
 9
9 7
7(note: this post is more economics heavy than typical. I do not have any sort of training in economics, so it’s very possible I’ve made a mistake somewhere in interpreting this. If you see one, please point it out!)
In general the evidence for long term lack of gains in construction efficiency is extensive enough that I haven’t felt compelled to dive into the specific measures documenting it. But (like with most things), the evidence isn’t so completely one-sided that any claims to the contrary can be immediately dismissed. And in general, the better we understand the various measures of construction efficiency, the better we can grasp the shape of the problem. So let’s take a look at a few of them.
When talking about efficiency, there are two sorts of indexes worth looking at. Cost (or price) indexes and productivity indexes. Cost indexes track how construction costs have changed over time, while productivity indexes track how the amount of output we get for a given input changes over time.
In general, understanding how the construction industry evolves requires looking at both types of indexes. We look at cost changes because that’s what we ultimately care about - whether (quality adjusted) buildings, especially houses, are getting more or less expensive over time. Productivity indexes are useful to the extent that they can give clues as to what’s driving cost changes. If construction was getting cheaper over time, and housing becoming more and more affordable, measures of construction productivity wouldn’t be especially pressing. If costs are increasing, however, productivity measures can help diagnose the problem. Because construction is so labor intensive, we’re often looking at measures of labor productivity to try to understand how the industry is (or isn’t) evolving, since we usually expect increases in productivity to be followed by lower costs. But we shouldn’t lose sight of the fact that cost is what we actually care about, and that productivity is just an occasionally useful proxy for it.
One reason for keeping this distinction in mind is that in construction, it’s possible to increase labor productivity without decreasing costs. This is what happened with many prior attempts at prefabrication or industrialized building - work gets shifted from laborers to machines and factories, so labor productivity goes up (in the sense that it takes fewer workers to get the same output), but the machines and equipment are so expensive that costs of construction don’t drop (in some cases, they go up!) [0]. So in addition to labor productivity, we also need to look at the rate at which capital can be substituted for labor. Evidence so far suggests that this exchange rate is not particularly favorable, in the sense that it takes a fairly large investment in machines, equipment, and factory space to replace what can be done by hand [1].
Price Indexes
Let’s start with cost indexes. One of the most popular (and most damning) is this graphic from AEI, which simply breaks out the cost changes over time of various goods included in the Consumer Price Index:
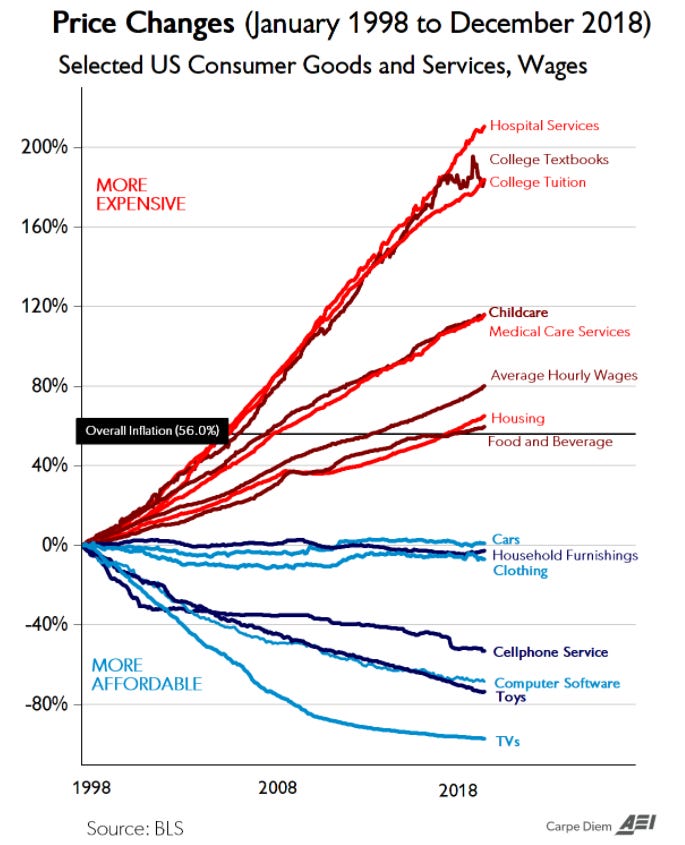
We see a clear break between labor-intensive services (which have gotten more expensive) and manufactured goods (which have gotten less expensive), with housing right in the middle. Housing prices are of course distinct from construction costs, since housing is influenced by many other things (local demand, zoning regulations, etc.). And of course, residential building is only a portion of the construction industry. So this graph alone is somewhat limited evidence. But it is consistent with a construction industry that’s failing to reduce its costs over time.
A better cost index is one that tracks the cost of construction directly. A variety of organizations produce measures of this. Many, like ENR’s cost index, are similar to the consumer price index in that they track the price of a basket of representative goods over time. Others, like the Mortenson Cost Index, track the cost of a representative building over time.
In general, the cost indexes I find most compelling are produced by Ed Zarenski at Construction Analytics. Ed (a former construction cost estimator) produces regularly updated building cost indexes (and provides comparisons to other cost indexes, which mostly align with his).
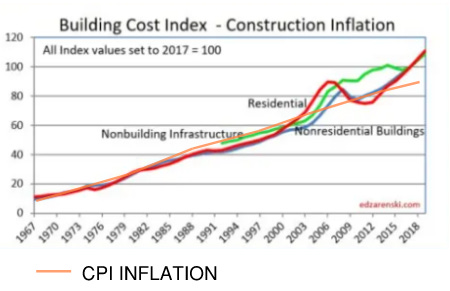
Zarenski provides separate indexes for residential, non-residential, and non-building infrastructure, a reasonably good breakdown which will (mostly) cluster similar activities together. Based on this data, we see that construction costs roughly track CPI inflation until about the early 2000s, after which costs start increasing faster (especially in residential construction). This trend reversed during the great recession, but has since picked up again.
This roughly matches what we saw when we compared 1947 construction costs to modern ones - modern ones were slightly (but not enormously) higher, consistent with a rate of cost increase that matched inflation for a long period of time and then increased.
It’s also consistent with the AEI graphic on housing costs. Since new construction is a small fraction of the existing building stock, if building costs are increasing faster than inflation, it would take a long time for this to show up in housing cost data (and could be mediated by many other factors).
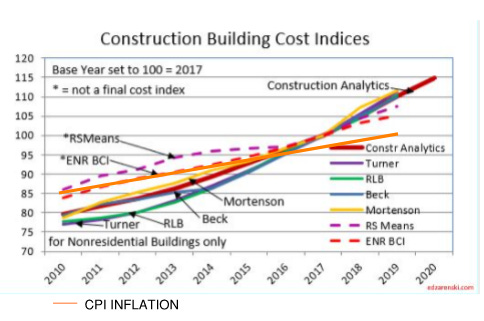
We also see that construction input indexes (such as RSMeans and ENR), which track the costs of construction inputs (labor, materials, services, etc.) have increased slower than output indexes, which measure the costs of a completed building. Input indexes seem to have tracked the rate of overall inflation for longer, though it seems like they too have started to increase faster in the last several years.
In general, I suspect cost indexes are reasonably accurate. They’re simple to construct, are based on fairly direct measurements, the folks that produce them have strong incentive to make them accurate (since their accuracy is something builders and developers are often paying for), and they’re mostly consistent both with each other and other data we’ve looked at.
Productivity Indexes
Now let’s look at productivity indexes. These tend to get a lot more attention than cost indexes, partly because the results make for a better soundbite ("zero progress in construction!"), partly because constructing them is hard so there is a lot to argue about.
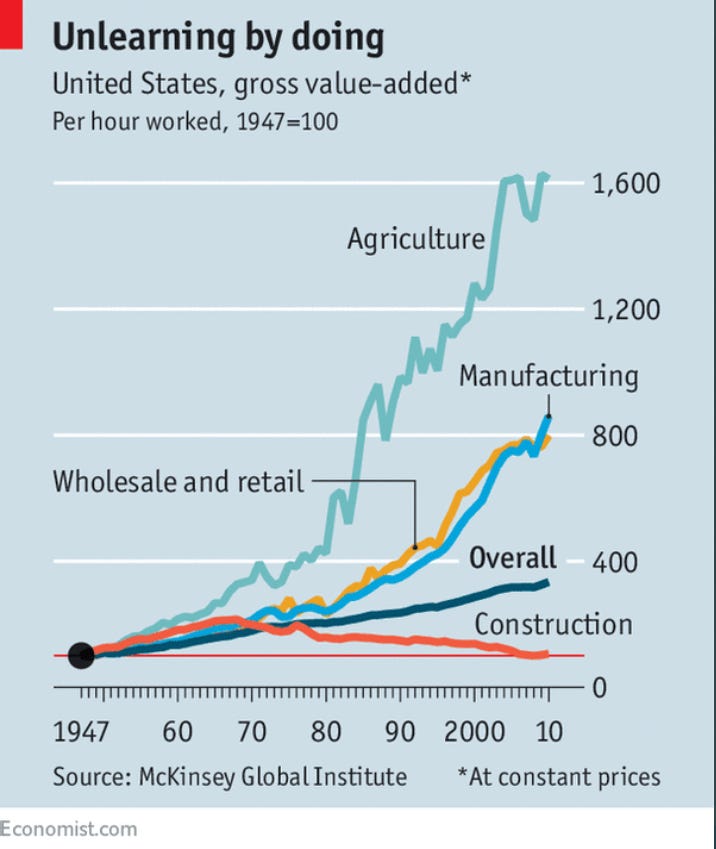
Like cost indexes, productivity indexes can be constructed at different levels of granularity. At the top, we have productivity indexes over the entire construction industry. These high-level views almost always show the same thing - decades of zero or negative productivity growth in the construction industry, almost always with a comparison to another industry to really drive home how dire the situation is. Here’s one from McKinsey:
And here’s another, from the Bureau of Labor Statistics:
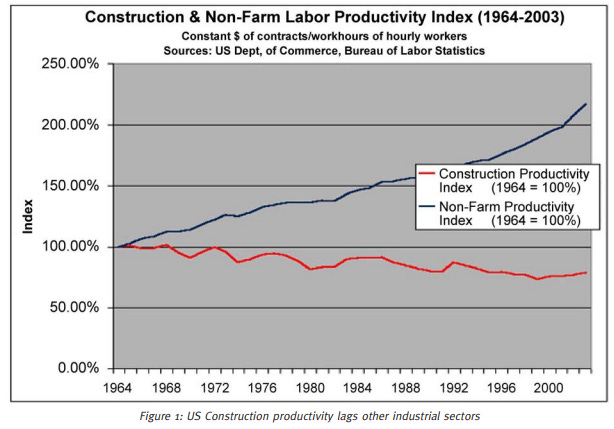
And here’s one from Paul Teicholz:
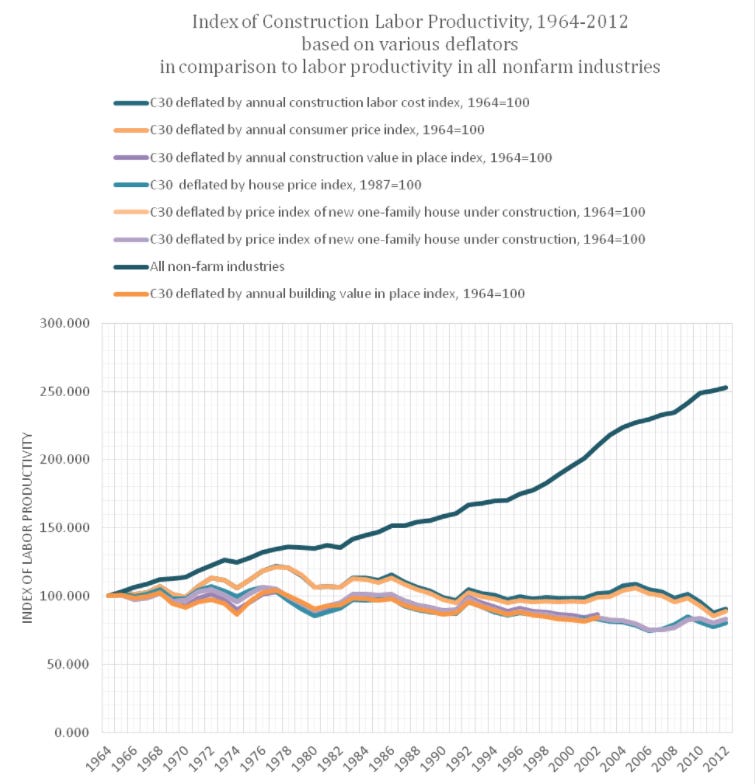
These indexes seem to mostly be constructed by taking some measure of total construction output, adjusting for price inflation with some sort of deflator, and dividing it by some measure of labor hours. Teicholz’ graph, for instance, is based on taking the entire output of the construction sector (as measured in dollars), and dividing by the number of hours worked (as reported to the BLS), adjusted by various measures of cost inflation. Picking an accurate deflator is nontrivial (more on this later), so Teichholz’ numbers helpfully show the results for a variety of different ones, though it (mostly) doesn’t seem to make much of a difference which deflator is chosen. The BLS graph appears to be constructed using a similar method.
These high level measures of productivity have a number of weak points. For one, they combine a bunch of fairly disparate activities - heavy civil construction is much different than high rise construction, which is much different than single family home construction, which is much different than renovation work. For another, they generally don’t adjust for changes in the relative proportions of various activities. If lots of effort moves out of high productivity areas into low productivity areas, that could look like declining industry productivity even if every individual activity was getting more productive (a version of Simpson’s Paradox). When Allen 1985 looked into this data from 1968 to 1978, this sort of change in the output mix (caused by workers moving out of capital-intensive civil construction and into labor-intensive single family home construction) was a large fraction of the productivity decline.
Another problem is that the deflators used are often input deflators, which will tend to underestimate both productivity gains and losses. If my input costs double, but I figure out a way to build the building for the same cost anyway with clever productivity improvements, I will underestimate the output if I divide by input costs. The reverse happens if productivity drops - if input costs stay the same but because of poor management I spend twice as much as I should to get the building built, dividing by input costs will overestimate the output (and thus productivity). We can actually see this occurring in Teicholz’ graph above - there are two distinct trend lines, which correspond to input and output deflators, with the input deflators overestimating productivity.
Still, we shouldn’t be too skeptical of these sorts of measures - you could make many of the same criticisms about "manufacturing", another broad category containing many disparate activities that has nonetheless shown sustained productivity growth.
But given their limits, it can be helpful to look at more granular productivity indexes. The best available ones I’m aware of are from the BLS, which provides labor productivity estimates broken down by construction type - single family, multi family, industrial, and highways, roads, and bridges. To try to get as accurate estimates as possible, the BLS adjusts these numbers using industry-specific deflators.
The data is fairly volatile, but it shows roughly the same pattern of no sustained productivity improvements (the one exception being multifamily construction).
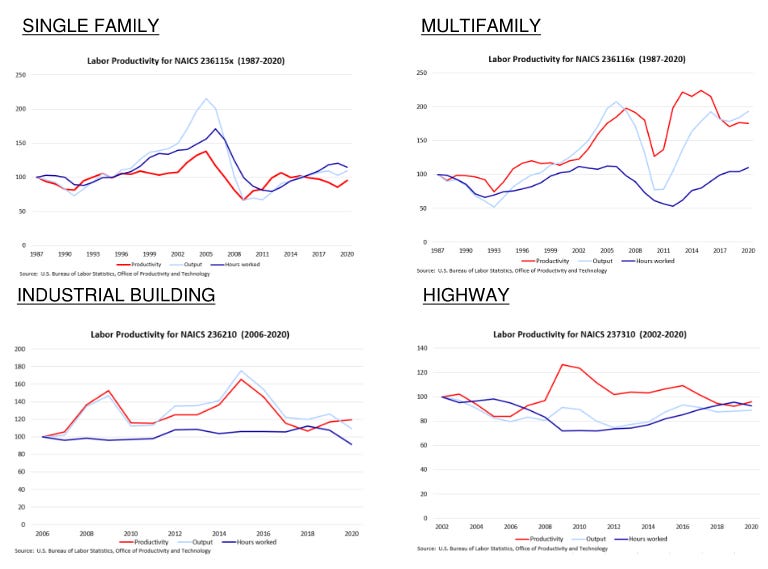
One major weakness of these measures is that they don’t adjust for the fact that builders are almost always subcontracting large portions of their work. Including subcontractor hours tends to drop productivity estimates even more (I suspect this would eliminate most of the measured productivity gains that remain in multifamily construction).
In general I’m fairly skeptical that there’s much signal in these BLS productivity indexes over the short term. For one, we see implausibly large productivity changes - on the order of 50% improvements over just 2-3 years. This is faster than we’d expect technological or organizational changes to propagate given the fragmented nature of construction and how long projects take to complete [2]. For another, we see as many productivity decreases as we do increases, which, outside of huge, industry-wide events (such as the great recession [3]), screams "random walk" to me.
Also, the productivity changes don’t match up with the changes in building costs (which we should be much more confident in.) It does not strike me as particularly plausible that multifamily productivity nearly doubled in the early 2000s, at the same time that costs were rapidly rising (in general we should expect the reverse relationship).
And despite being focused on different construction types, these measures still have many of the same problems as the industry-wide measures. They’re still clumping together fairly disparate activities (for multifamily construction, a high rise built in NYC is much different than a garden apartment built in Texas), and can’t easily track changes in the output mix (such as construction shifting from highly-regulated California to lightly-regulated Texas).
One way of addressing this is to go even MORE granular, and drop down to the level of individual construction tasks (pouring foundations, framing walls, laying brick, etc.). This can be done by pulling data from estimating manuals like RSMeans, which provide cost and productivity data (square feet built per hour, etc.) for a huge number of individual construction tasks. Tracking these values over time gives an idea how productivity is changing at the task level.
Doing this resolves many of the issues with the higher level, more abstract measures. Since comparisons are within a single task, you’re not lumping together disparate activities. You eliminate most "output mix" problems, since the same task will generally be done in similar ways everywhere. You don’t have to make the complex corrections and adjustments that the higher-level measures require. And you can piggyback on the incentives RSMeans has to get accurate data (since developers and builders are paying for it). The downside is that you lose the ability to diagnose productivity changes at the "assembly level".
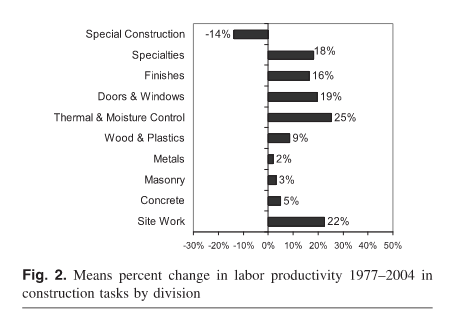
When Goodrum 2002 looked at this, he found that on average, task-based productivity actually increased substantially between 1976 and 1998 (though there was significant variation from task to task):
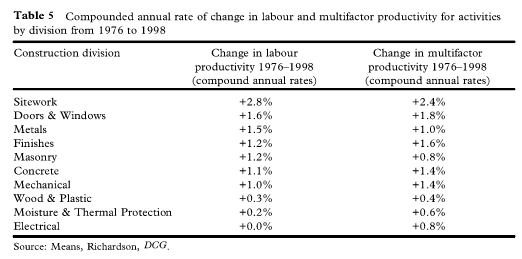
But not all activities showed an increase in productivity - for some tasks productivity stayed flat, and others declined:
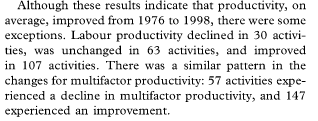
This strikes me as plausible. We KNOW there have been technological improvements that we’d expect to be productivity improving in some areas - better power tools, better material moving equipment, prefabrication of doors and windows (which used to be site built), better materials, etc. It would be very strange if those sorts of improvements didn’t show up anywhere.
It also shows up in RSMeans’ historical cost index - over the period of time analyzed (1976 to 1998), construction costs increased slower than the overall inflation rate, consistent with improving productivity. Unfortunately, for most other periods this isn’t true - in general, RSMeans cost index increases at or faster than overall inflation, suggesting task productivity improved for a brief period then stopped. When Goodrum did another, similar analysis and included data through 2004, the productivity gains were still positive, but were lower than they were in 1998:
I’d be interested to look at an updated analysis with more recent data, and see what the productivity trends were.
Conclusion
So, to sum up.
When looking at construction efficiency, we need to look at both price and productivity indexes, as well as how easily/efficiently we can substitute capital for labor.
Building cost indexes roughly match the overall rate of inflation until the 1990s, after which they began to rise faster than inflation.
Building input cost indexes fluctuate, sometimes rising faster than inflation, sometimes slower. Periods where they rise slower than inflation seem to show construction productivity improving at the task-level.
High level productivity measures indicate that construction productivity is generally flat (consistent with a building cost increase that matches the inflation rate). However, these measures are very coarse and mask many differences (such as changes within the output mix).
Productivity measures at the level of individual industries also suggest that productivity is mostly flat, although this data is extremely noisy, and year-to-year changes don’t seem to make much sense.
Productivity measures at the level of individual tasks show some improvement, over some periods of time, but don’t appear to be sustained.
Overall, I don’t see much that changes the overall diagnosis of construction efficiency stagnation.
[0] - There are reasons this still might be a worthwhile trade, for example reaching the sort of scale that would be unachievable (or too expensive) with a more labor-intensive process.
[1] - More specifically, there’s a large discontinuity in capital substitution. You can get large initial gains with things like power tools and telescopic handlers, but you quickly reach a point where substituting additional labor is harder and more expensive.
[2] - You could make an argument that long project times would result in ‘bursts’ of productivity improvement like this - a builder can’t change processes in mid-project because it would be disruptive, but when the next project starts they can take advantage of several years of productivity improvements all at once. I don’t think that’s what’s going on with construction, but it’s not impossible.

 9
9 7
7