- Real Estate TopicsReal Estate Topics
 Your resource for all things Real Estate. Including Legal, Agent & Broker, and Property Rights Issues.
- Competition in Real EstateLocal broker marketplaces ensure equity and transparency.
- MembershipProviding Membership Value
 Whether you’re a new agent or an experienced broker you have access to a wide array of resources designed to help you succeed in today's market.
- All Membership Benefits
- NAR REALTOR Benefits®Bringing you savings and unique offers on products and services just for REALTORS®.
- DirectoriesComplete listing of state and local associations, MLSs, members, and more.
- Dues Information & Payment
- Become a MemberAs a member, you are the voice for NAR – it is your association and it exists to help you succeed.
- Logos and Trademark RulesOnly members of NAR can call themselves a REALTOR®. Learn how to properly use the logo and terms.
- Your Membership AccountReview your membership preferences and Code of Ethics training status.
- Research & StatisticsMarket Behavior
 Including home buying and selling, commercial, international, NAR member information, and technology. Use the data to improve your business through knowledge of the latest trends and statistics.
- Highlights & NewsGet the latest top line research, news, and popular reports.
- Housing StatisticsNational, regional, and metro-market level housing statistics where data is available.
- Research ReportsResearch on a wide range of topics of interest to real estate practitioners.
- Presentation SlidesAccess recent presentations from NAR economists and researchers.
- State & Metro Area DataAffordability, economic, and buyer & seller profile data for areas in which you live and work.
- Commercial ResearchAnalysis of commercial market sectors and commercial-focused issues and trends.
- Statistical News Release Schedule
- AdvocacyRepresenting Your Industry
 NAR is widely considered one of the most effective advocacy organizations in the country.
- Advocacy Issues & News
- Federal AdvocacyFrom its building located steps away from the U.S. Capitol, NAR advocates for you.
- REALTORS® Political Action Committee (RPAC)Promoting the election of pro-REALTOR® candidates across the United States.
- State & Local AdvocacyResources to foster and harness the grassroots strength of the REALTOR® Party.
- REALTOR® Party(link is external)A powerful alliance working to protect and promote homeownership and property investment.
- Get InvolvedNow more than ever, it is critical for REALTORS® across America to come together and speak with one voice.
- EducationAdvancing Your Career
 NAR and its affiliated Institutes, Societies, and Councils offer a wide selection of real estate training options.
- All Education & Professional Development
- All NAR & Affiliate CoursesContinuing education and specialty knowledge can help boost your salary and client base.
- Code of Ethics TrainingFulfill your COE training requirement with free courses for new and existing members.
- Continuing Education (CE)Meet the continuing education (CE) requirement in state(s) where you hold a license.
- Designations & CertificationsAcknowledging experience and expertise in various real estate specialties, awarded by NAR and its affiliates.
- Library & ArchivesOffering research services and thousands of print and digital resources.
- Commitment to Excellence (C2EX)Empowers REALTORS® to evaluate, enhance and showcase their highest levels of professionalism.
- NAR Academy at Columbia CollegeAcademic opportunities for certificates, associates, bachelor’s, and master’s degrees.
- News & EventsNews & Events
 Stay current on industry issues with daily news from NAR. Network with other professionals, attend a seminar, and keep up with industry trends through events hosted by NAR.
- Latest News
- NAR NewsroomOfficial news releases from NAR.
- REALTOR® Magazine(link is external)Advancing best practices, bringing insight to trends, and providing timely decision-making tools.
- BlogsCommentary from NAR experts on technology, staging, placemaking, and real estate trends.
- NewslettersStay informed on the most important real estate business news and business specialty updates.
- NAR NXT, The REALTOR® Experience
- REALTORS® Legislative Meetings
- AE Institute
- Real Estate Forecast Summit
- C5 Summit
- Leadership Week
- iOi Summit
- All Events
- About NARWho We Are
 America's largest trade association, representing 1.5 million members, including NAR's institutes, societies, and councils, involved in all aspects of the residential and commercial real estate industries.
- Mission, Vision, and Diversity & Inclusion
- Code of Ethics
- Leadership & StaffNational, state & local leadership, staff directories, leadership opportunities, and more.
- Committee & Liaisons
- HistoryFounded as the National Association of Real Estate Exchanges in 1908.
- Affiliated Organizations
- Strategic PrioritiesNAR’s operating values, and long-term goals.
- Policies
- Governing DocumentsCode of Ethics, NAR's Constitution & Bylaws, and model bylaws for state & local associations.
- Awards & GrantsMember recognition and special funding, including the REALTORS® Relief Foundation.
- NAR's Consumer Outreach
You are here
Land Sales Rose 2% in 2019, With Steady Growth in 2020, According to RLI-NAR Survey
The dollar volume of land sales and land prices per acre rose across all land types during the 12-month period of October 2018–September 2019, according to land estate agents who participated in the 2019 Land Market Survey, a joint survey conducted by the REALTORS® Land Institute and the National Association of REALTORS®. Respondents expect a modest increase in land sales but somewhat slower land price appreciation in 2020. Zoning regulations and obtaining financing were cited as major issues affecting land transactions.
Land Sales Trend and Prices in 2019
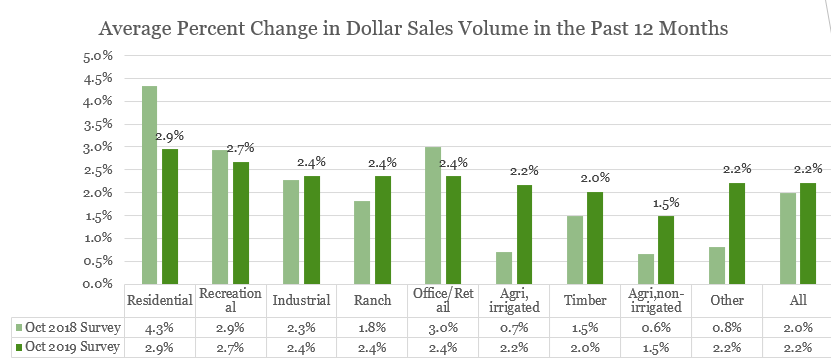
Dollar sales volume rose on average by 2.2% for all types of land during the reference period of October 2018–September 2019 compared to one year ago. Residential land sales had the largest year-over-year increase, at 2.9%. Residential land sales received a boost from the decline in mortgage rates in 2019 in the wake of three federal funds rate reductions in 2019 that resulted in a total interest rate cut of 0.75%. Land for recreational use (e.g. hunting, fishing, camping ) also showed a strong growth of 2.7%. Land for recreational use is associated with the sale of vacation homes. Land for industrial and office/retail use rose 2.4%. The demand for industrial land is associated with the demand for warehouse and logistics arising from the growth of e-commerce, as well as for manufacturing. Agricultural non-irrigated land posted the slowest sales growth of 1.5% as agricultural land sales continue to be impacted by the slump in prices of food commodities, livestock and cattle, and logs/lumber/timber.
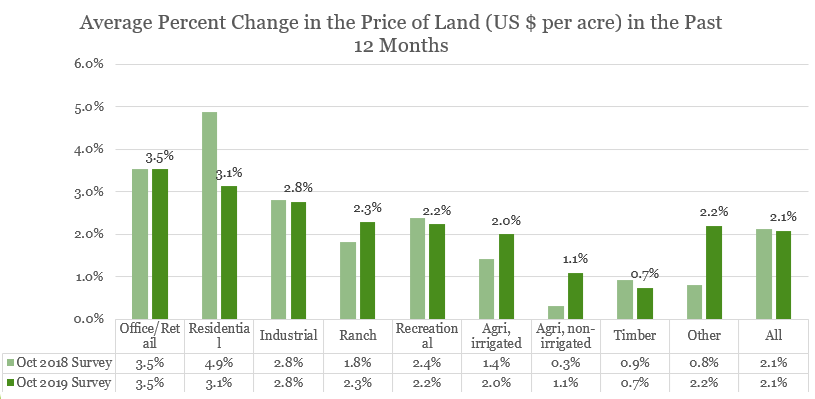
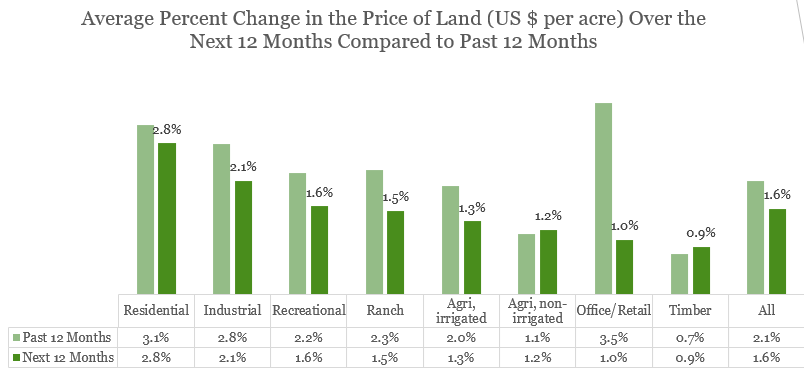
Respondents reported an increase in the price per acre of all land types. The price per acre of land for office/retail rose 3.5% on a year-over-year basis, residential land prices increased by 3%, and industrial land prices rose 2.8%. The lowest price increases were in agricultural non-irrigated land and timberlands, which each rose by about 1%.
A comparison of the market trends above to national market trends or to the residential and commercial property market (homes and buildings) shows that the land business of respondents is in line with national-level data, accounting for some variation due to sampling error.
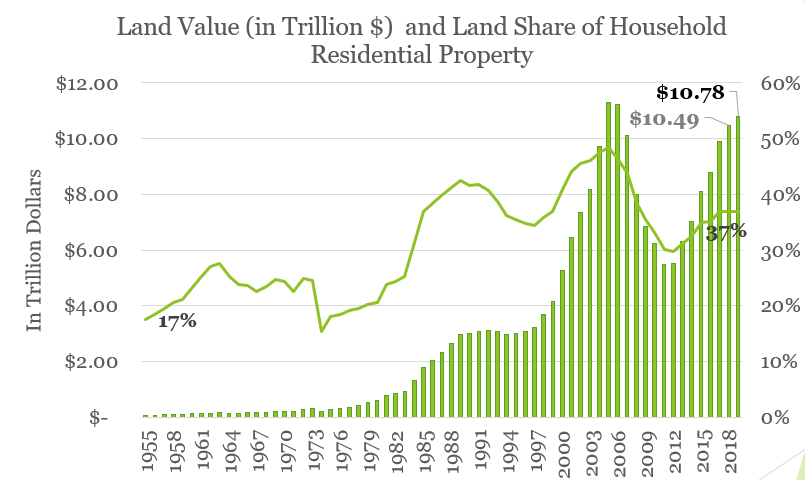
Accounting for sampling error, the 3.1% increase in residential land prices reported by respondents is in line with the 2.8% increase in the value of residential land assets of households during 2018 through 2019 Q3. The market value of household land real estate can be estimated by subtracting from the market value of residential property held by households the replacement cost of residential structures, based on data from the Federal Reserve Board’s Household Balance Sheet Table B.101.1 In 2019 Q3, the estimated market value of residential land held by households was $10.78 trillion ($29.1 trillion in residential real estate less $18.4 trillion in replacement cost of structures), which is a 2.8% increase from the $10. 49 trillion in household land assets in 2018.
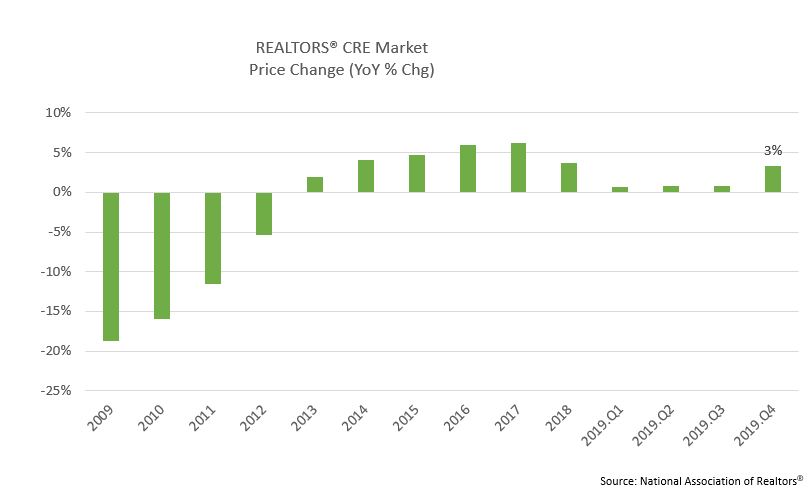
Accounting for sampling error, the 2.8% to 3.5% price increase for industrial and office lands is in line with the 3% price gain for commercial real estate sales transactions reported by REALTORS® in a 2019 Q4 Commercial Real Estate Market Quarterly Market Survey.
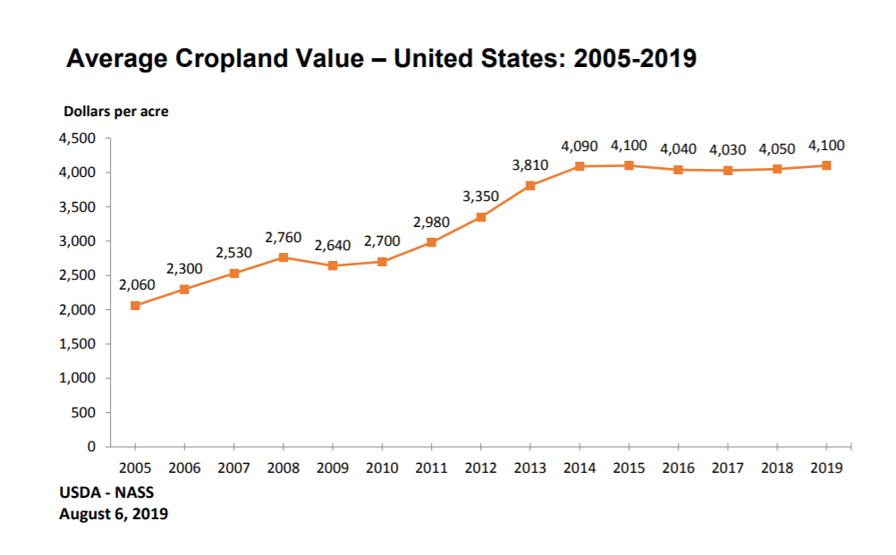
Accounting for sampling error, the 2% increase in irrigated agricultural land prices is in line with the 1.2% increase in the average cropland value in the United States from 2018 to 2019 published by the U.S. Department of Agriculture. The average cropland value rose from $4,050 dollars per acre in 2018 to $4,100 per acre in 2019.
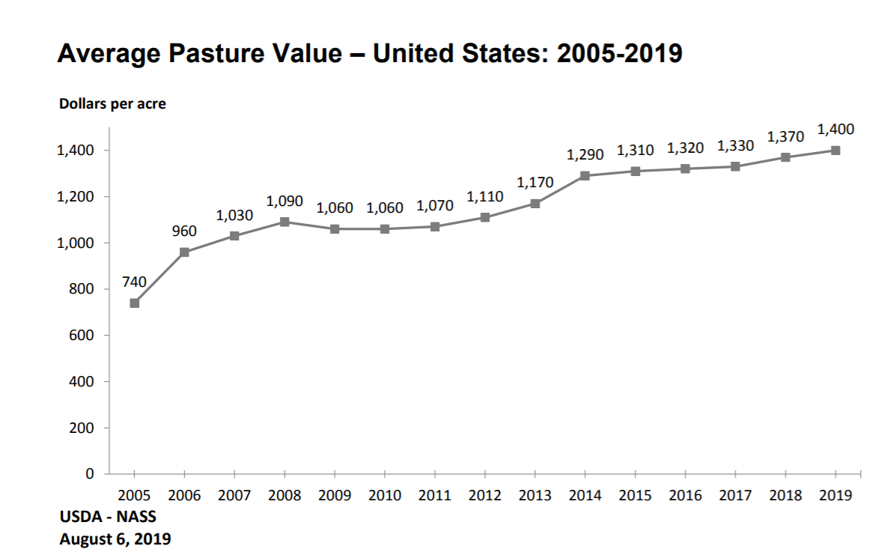
Accounting for sampling error, the 1.1% increase in non-irrigated agricultural land prices from the survey is in line with the 2% increase in the average pastureland value in the United States from 2018 to 2019 published by the U.S. Department of Agriculture. The average cropland value rose from $1,370 dollars per acre in 2018 to $1,400 per acre in 2019.
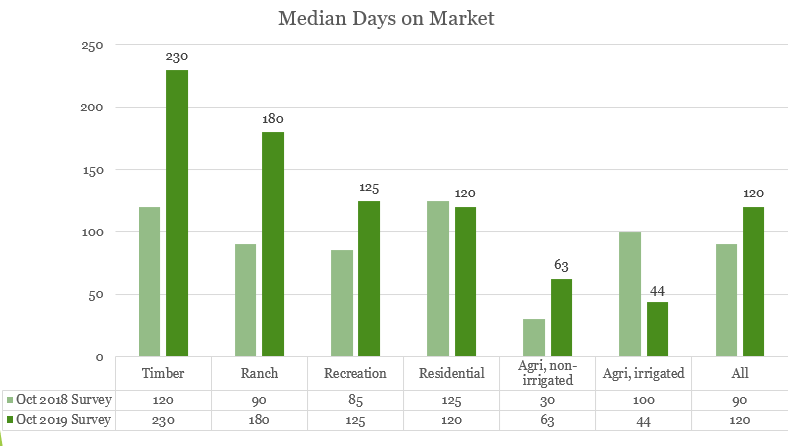
Land sold during October 2018-September 2019 stayed on the market for a longer time at 120 days compared to sales during the prior 12-month period, with respondents reporting longer selling time for timber, ranch, recreation, and non-irrigated agricultural lands.
Sales and Price Outlook in 2020
On average, respondents expect land sales to broadly increase at the same pace of 2.2% in the next 12 months, with sales increasing across all land types, led by residential land at 2.8%. Accounting for margin of error, the increase in residential land sales is in line with NAR’s forecast of 4% growth in existing and new home sales in 2020, from 6.02 million in 2019 to 6.27 million in 2020.
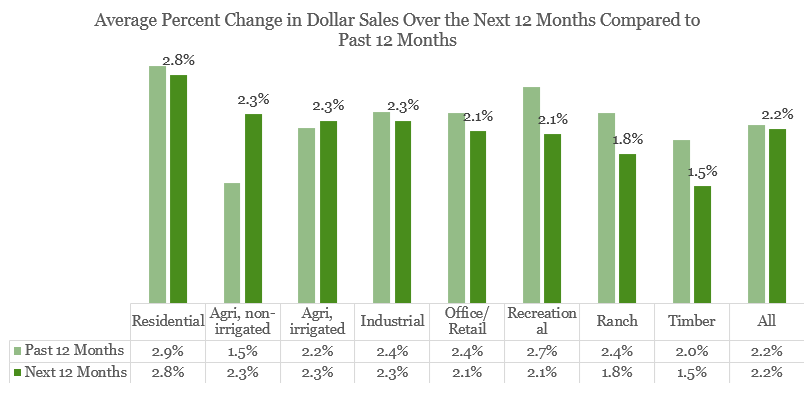
Respondents expect prices to increase at a slower pace for most types of land. On average, respondents expect land prices to grow at 1.6% from September 2019 to September 2020.
Land Market Issues
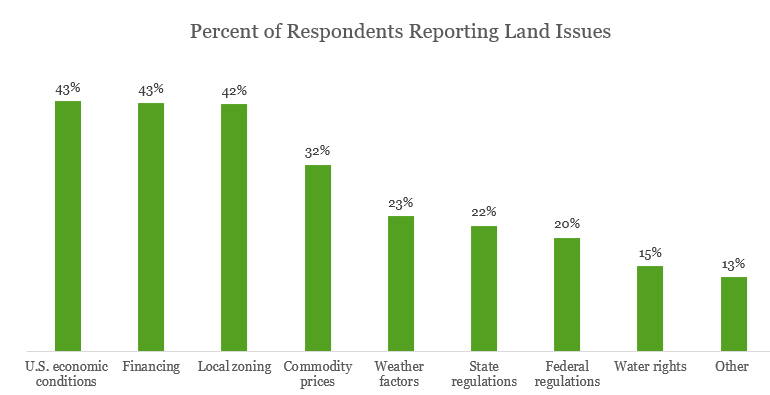
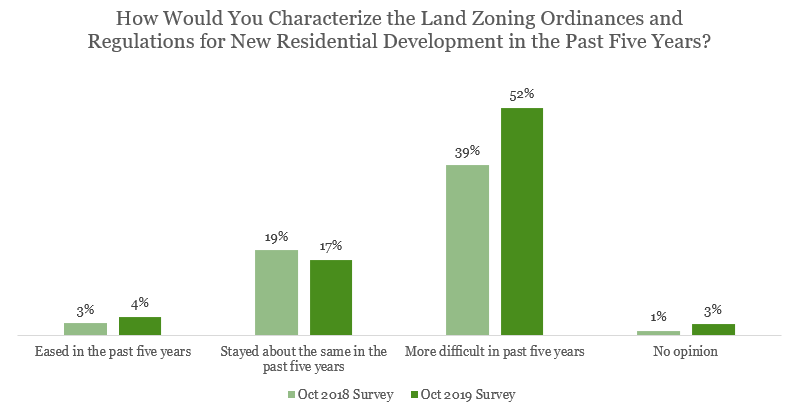
The survey asked respondents if economic, financing, regulatory, and weather-related problems affected their land transactions. Forty percent of respondents reported they considered U.S. economic conditions, access to financing and zoning regulations as "land issues." Nearly half of respondents reported that residential land zoning ordinances have become more difficult in the past five years, up from 39% of respondents in the 2018 survey. Commodity prices were reported as an issue by 32% of respondents, and weather factors by 23%.
"Other" issues were:
- • High impact fees
- • Construction and labor costs
- • Builder and utility costs
- • High real estate taxes
- • Flood insurance and need for updated flood maps
- • Increasing fire insurance
- • Water availability and water rights
- • Wind rights
- • Not enough farmland for sale
- • Migration from other states (California, New York, and Illinois) pushing land prices
About the Survey
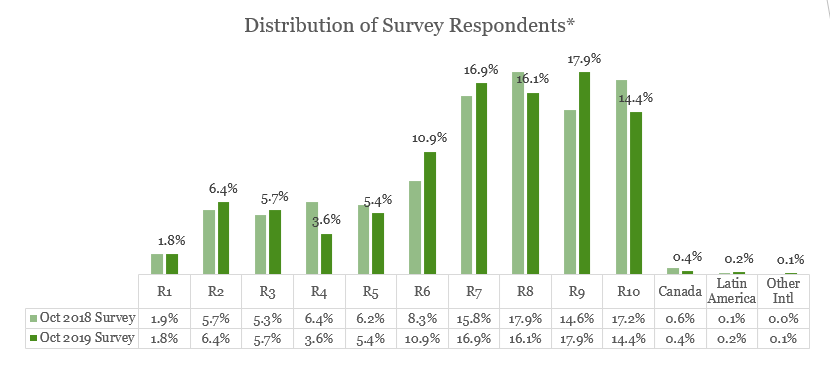
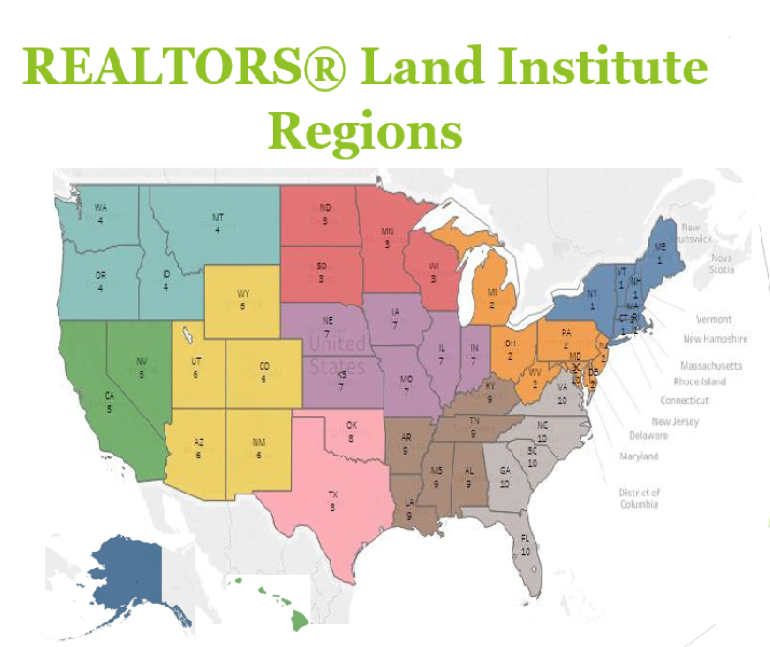
RLI sent out the online survey to 1,323 RLI members and approximately 5,500 non-member agents who are engaged in land transactions from October 6–November 17, 2019. Of these, 826 responded to the survey. The 2019 survey gathers information on transactions during the reference period of October 2018 – September 2019.
1 Using the cost approach method to estimating land values: Land value=real estate residential assets of households less replacement cost value of residential structures. The replacement cost is the cost to replace an improvement (building) with another improvement having the same utility.


