How much do construction costs matter? Some factors that affect the price of housing
One of the goals of this newsletter is to figure out ways to improve construction productivity and reduce the costs of construction, particularly residential construction (ie: housing) - if you could reduce the costs of construction, housing costs would fall as well. Roughly 15-18% of US GDP goes towards housing costs (including mortgages, rents, and construction of new homes), and fraction of income spent on housing is inversely proportional to income, so being able to reduce costs associated with it would have substantial benefits.
But outside of this little corner of the internet, there’s relatively little focus on construction costs as a driver of housing costs. Instead, discussions of housing cost tend to be focused on what we might call ‘price distortions’ - increases in housing costs caused by things like zoning rules, height caps, onerous permitting requirements, and other policy decisions [0]. These factors are a major focus of urban economists, and of policy advocates like Brookings, Niskanen, and the YIMBY movement. They’re also fairly central in housing discussions in major media outlets such as the New York Times, the Wall Street Journal, and the Atlantic (as well as smaller publications like Works in Progress.)
I suspect this is at least partly due to the fact that urban areas like San Francisco and New York, which have a disproportionately large influence on what gets discussed in major media outlets [1], have both extremely high housing costs, and extremely restrictive building policies that limit housing construction.
This isn’t necessarily unreasonable - supply restrictions are a problem with a clear path towards a solution (let people build more houses!), and it’s a solution that can (theoretically) be reached by getting the right people paying attention and talking about it. So it makes sense for media discussions around housing costs to focus on them - you won’t be able to reduce construction costs by writing an op-ed in the New York Times, but it might help get SB9 passed. But because it’s so central to the conversation, it would be easy to get the idea that policy decisions are the main thing that affect housing costs, and (implicity) that construction costs don’t matter as much. So it’s worth diving into some of the factors that affect the price of housing, and how construction costs fit in.
Land and structure
We can think of housing as a bundle of a parcel of land and a structure (plus other improvements) sitting on top of it. We can thus break down the cost of housing into a) the cost of putting up the structure, and b) the cost of the land it sits on [2]. For single family homes, this breakdown is often done by taking the purchase price of a house, then subtracting the (depreciated) costs of construction, typically determined by using RS Means or similar construction cost data [3]. What’s left is the value of the land itself. When using this method of cost breakdown, outside of price distortions that increase the cost of construction (which we’ll look at), price distortions caused by limits on how much housing can be built will show up as increased land prices, assuming you keep the amount of housing per lot constant (more on this later.)
One way to think about it is that land is also a bundle, consisting of a ‘hedonic’ or consumption portion (the value people get from having the land itself) and a ‘permission slip’ that allows you to build a certain quantity of housing on it. In general, the hedonic value of land is fairly low - when Ed Glaeser calculated this for 21 metro areas in early 2000 (by analyzing home price sales and estimating how much a larger lot added to the home’s value), he found that in 16 of them, the hedonic value was less than (inflation adjusted) $1.50 per square foot, or less than $12,000 dollars for the median lot size of ~8,000 square feet (though we should be careful with a simple inflation adjustment of this hedonic value [4].) By comparison, the median new home in 2020 sold for around $330,000.
A similar study of single family homes in Boston found that the hedonic value of land for the average lot was just $11,200, compared to an average house cost of $450,000.
The permission slip, by contrast, is often incredibly valuable, especially if the permitting body limits how many of them it gives out [5]. For instance, in the previous study Glaeser calculated the hedonic value of land for single family homes in San Francisco at $4.10 per square foot (the highest out of any metro examined), or about $10,000 for the average lot size at that time. The ‘zoning tax’ portion, by contrast (the portion of the cost due to various building and supply restrictions), was priced at around $220,000 - in other words, over 95% of the land’s value (and over half the price of the house), was due from being allowed to build on it [6].
Similarly, multifamily developers have told me that they will generally value land in terms of how many housing units they’re allowed to build on it. Increase the number of housing units you’re allowed to build (say, by getting it rezoned), and you greatly increase the value of the land. This is a lever developers have to work with when putting together a development deal - they might decide to take a risk and buy a cheaper piece of land that’s zoned for a relatively small number of units, in the hopes of getting permission to build more on it than is currently allowed.
One effect of this is that supply restrictions increase land price overall, but density restrictions (limits on how much you can build on a given lot) can actually decrease land price on certain lots, if they prevent you from building as many units as you otherwise might (a lot in San Francisco might be outrageously expensive for a single family home, but it nonetheless might be even more valuable if you were allowed to build a skyscraper on it.) This study in China, for instance, found that the higher the allowed Floor-Area-Ratio, the greater the value of urban land, and this study found similar results for New York. This is perhaps why San Francisco has both higher housing costs than New York, and lower land value per acre.
Land value and existing housing
So supply restrictions can matter a lot for the price of…a lot. Of course, most jurisdictions aren’t New York or San Francisco - if we look at the whole US, what fraction of existing residential real estate price is the land itself?
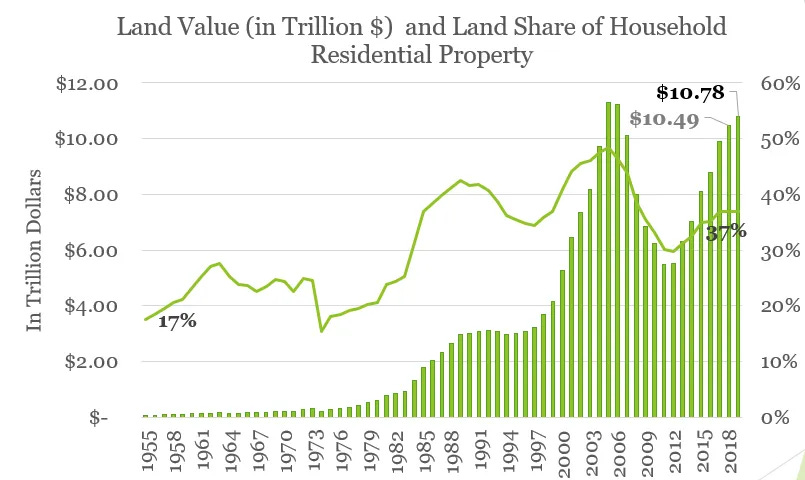
This varies over time, and depends on how you measure it. In 2019 land made up around 37% of the value of household residential property (with the remaining 63% the replacement cost of the structure):
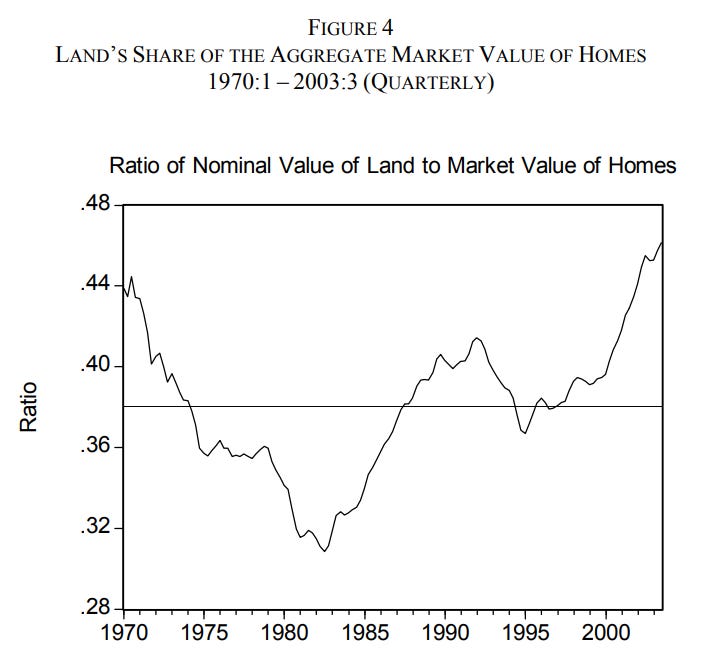
Other measures of land’s share of residential real estate value seem to mostly align with this. This paper from the Federal Reserve, based on "land value of all 1-4 unit residences" (~70% of housing in the US) agrees between ~1980 and 2003 (though has a weird divergence pre-1990):
This land fraction has fluctuated over time - at the height of pre-financial crisis values it was nearly 50% of home prices, but drops to the mid-20s at the nadir of recessions.
It also varies greatly depending on location. This visualization from AEI shows the largest 100 metros in the US (which account for around 2/3rds of the US population), and the land share fraction by county for single-family homes. This shows a median value of a 48% land fraction in 2020 (consistent with 37% fraction for all residential property, since areas outside the 100 largest metros can be assumed to have less valuable land.)
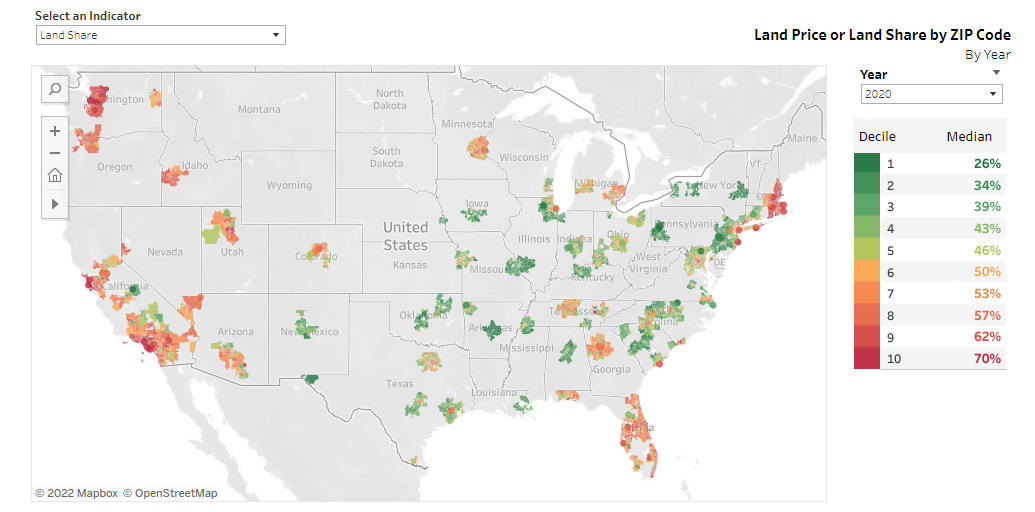
But we see a great deal of variance, from 26% land fraction in the lowest decile to over 70% in the highest decile (and this data doesn’t cover places with even cheaper land.) If we look at individual counties, we sometimes find land share values of up to 85% in some metros. Here’s San Francisco:
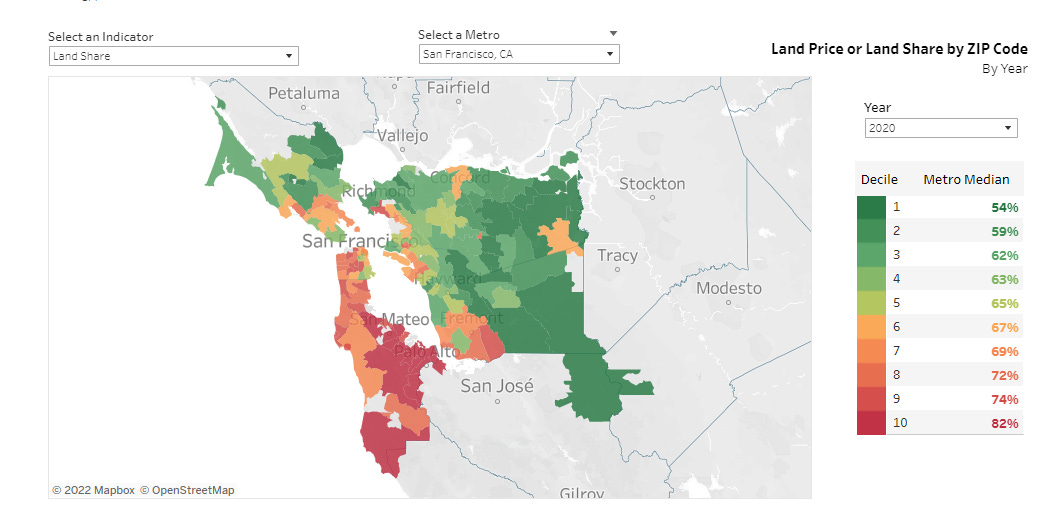
Even less expensive cities tend to have expensive urban cores, at least if you’re trying to build a single family home. Here’s Houston:
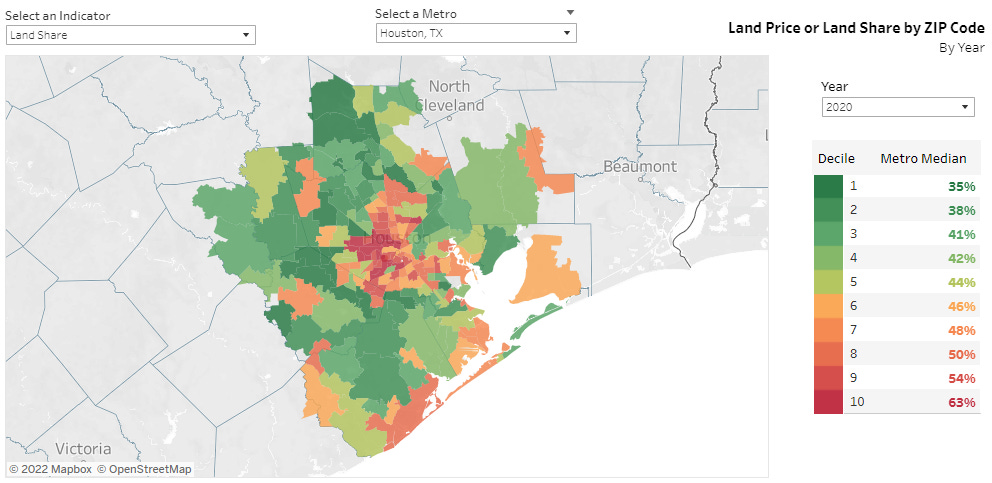
The closer you get to the urban core, the larger the fraction of housing costs due to land cost (though obviously this is particularly acute for single family homes and other low-density construction - land fraction will go down if you can build denser, even if your land price goes up.)
One possible factor in this breakdown is the gradual aging of the housing stock - the average age of a home in the US went from 23 in 1980 to 42 in 2020. Depending on what depreciation rate you use when calculating your replacement cost (the Fed seems to use a rate between 1.1 and 1.5% depending on the year of construction), this would have the effect of making land cost a larger fraction of real estate value without any sort of change in demand, policy, or replacement cost.
Land value and new construction
So on average, the cost of the structure itself is around 60% of the value of residential real estate, with a great deal of variance depending on where you are and how expensive the land is.
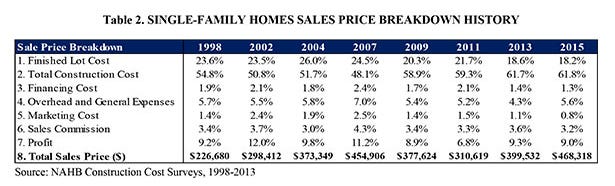
But those values are for existing housing. For new construction, we tend to see land make up a smaller fraction of overall costs. NAHB’s 2020 survey of homebuilders found an average land price of just 18.5% of the overall costs, with 61% of the remaining costs due to construction directly and ~20% due to profit and overhead (which you may or may not decide counts as construction costs - estimates of replacement costs based on RS Means tend to include builder profit.) Keeping the proportion of land cost below 20% for a new house is apparently a popular rule of thumb for homebuilders, and we don’t see a huge amount of deviation from this even at the peak of pre-crisis exuberance. We actually see a slight tendency towards a lower proportion of costs due to land, and a higher proportion due to construction cost, over time (though there’s a lot of variance here):
We get a similar cost fraction if we look at government statistics. Per FRED data, the median price of a new single family home in 2020 was around $330,000, and per census data the median size of the new single family home was around 2300 square feet, giving a median price per square foot of $150. At a construction cost of around $100-115 per square foot ("typical" values), this gets us just over 70% of the cost of the median single family home as due to construction cost, roughly in line with NAHB values.
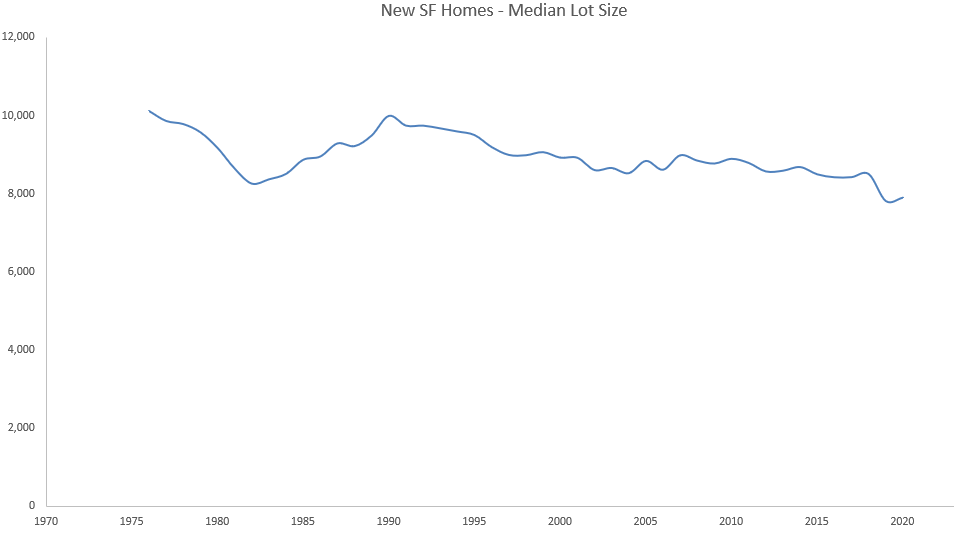
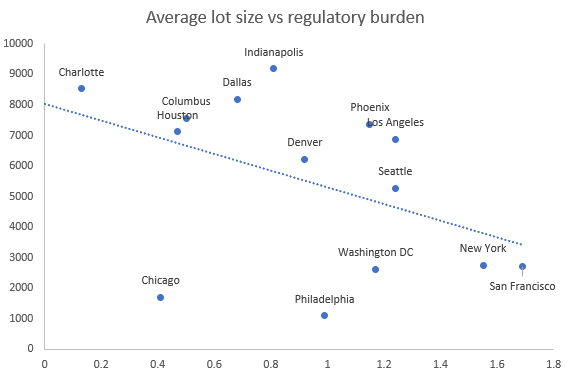
This relatively low land fraction is likely partially due to the fact that urban areas gradually expand outward over time, so new construction will be disproportionately on non-central, less-valuable land. It’s also likely due to the fact that, in line with Glaeser’s suggestion that people don’t actually value land very much, median lot size for new homes has been steadily decreasing since the early 1990s [7]:
So that’s for single family homes. And based on conversations with developers, multifamily property cost breakdown is somewhat similar: on average perhaps 15-20% of the cost will be the land, with another 50-60% going to ‘hard’ costs (the costs of the physical structure) and the rest of ‘soft’ costs (overhead, design, financing, administration, profits, etc.) This breakdown by Brookings of multifamily development costs gives similar proportions.
Supply restrictions and construction costs?
So for new construction, land is (on average) perhaps 20% of the cost or less, with 60-80% due to the costs of construction (depending on what you count as construction costs.) This suggests that for most new housing that's currently built, the effects of zoning and other supply restrictions aren’t a particularly large fraction of the cost.
One objection to this would be that supply restrictions might show up as increased construction costs as well. But if we look at land use regulation burden (as measured by the Wharton Regulation Index) vs construction cost on a city-by-city level (as measured by RS Means city cost index, we don’t really see much of a relationship:
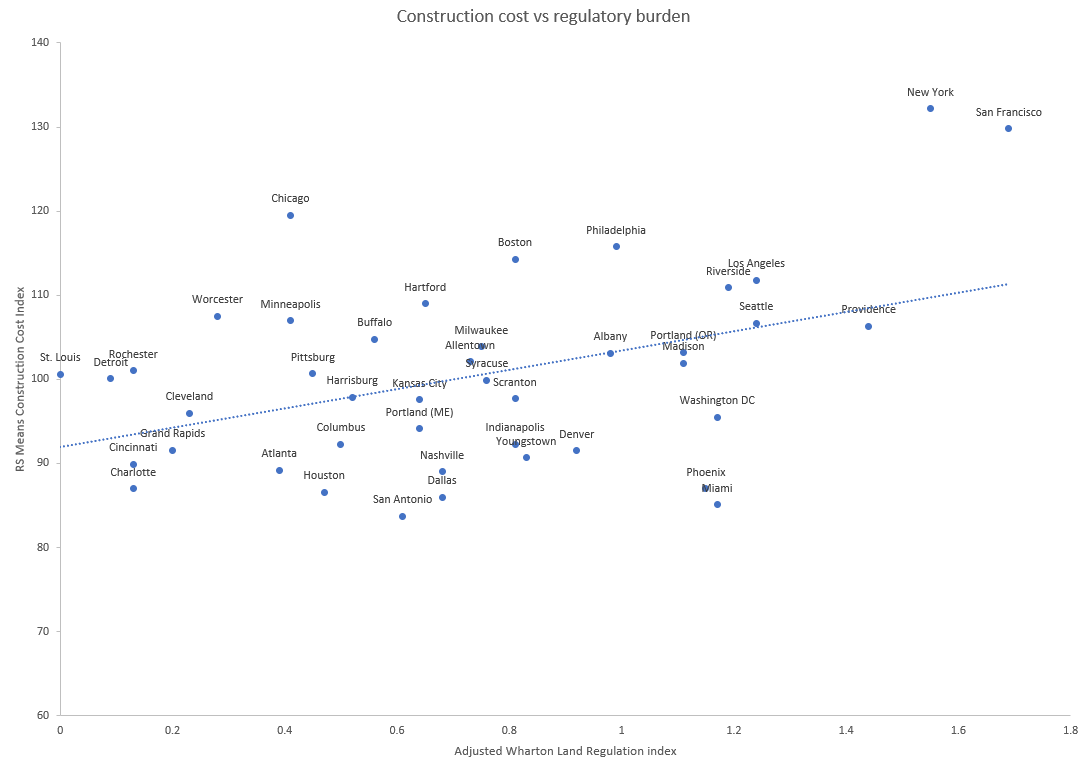
(The correlation here is basically entirely driven by New York and San Francisco; remove those and even the slight positive relationship essentially disappears, going from an R^2 of ~0.19 to ~0.03)
And looking at city cost indices, we don’t see a huge spread between the least and most expensive cities - the most expensive city is less than 2x the cost of the least expensive, and construction costs in general will have lower variation than housing costs. This is partially due to the moderating effect of building material costs, which make up a large fraction of construction costs and tend to vary less from region to region.
We see something similar in Census data, which tracks price of new housing with land costs removed:

We see that a) median costs don’t vary much from region to region, and b) they don’t vary much from what NAHB tells us "average" construction cost for single family homes are. We also see that the averages in the west and especially the northeast are significantly higher than the median, suggesting some large outliers in construction cost skewing the data (hello NYC and SF.)
So it doesn’t seem to be the case that supply restrictions have large impacts on construction costs.
Another objection would be that if construction costs fall, if supply restrictions don’t change then people would simply bid up the price of land until total housing costs were the same.
I think the evidence for this is mixed. On the one hand, a world where land is on average 20% or less (sometimes much less) of the cost of new housing construction doesn’t seem like a world where everyone is bidding up the price of new housing based on some existing supply cap. Even at the peak of pre-financial crisis prices, land fraction stayed below 30% of new construction on average.
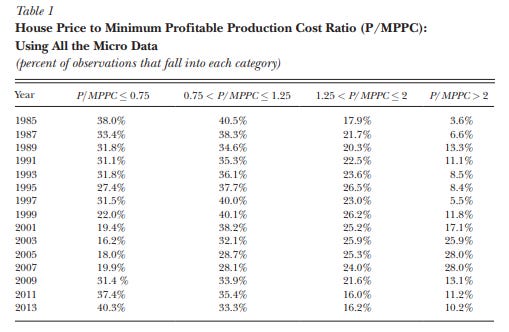
And in yet another study by Glaeser where he examined the house price of 98 different urban regions (containing around 75% of the US population), just under 3/4ths of home prices were at or near the "minimum profitable production cost":
In practice, many supply restrictions aren’t strict caps, but things that slow down projects and make them riskier, limiting the rate of new construction - long and burdensome environmental review processes, zoning board meetings, or just months sitting on some plan reviewers desk.
On the other hand, we do see that in cases of high demand housing prices can get broadly bid up far beyond their production cost (this can be seen in the table above from about 2001 to 2007, right before the financial crisis.) The table above stops at 2013, close to the low-point of post-financial crisis home prices - a table constructed today would probably look closer to the early 2000s distribution.
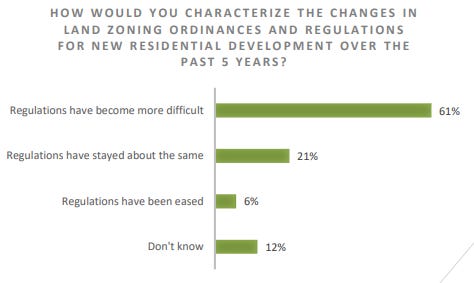
And zoning and land use regulations are continuing to get more burdensome - in a 2020 survey of realtors, 61% of them said that regulations had gotten more difficult (compared to just 6% that said they had gotten less difficult):
In some ways, housing that’s built under current restrictive practices is a sort of "bomber with red dots" situation - the real distortion isn’t the high costs per se, but all the housing that doesn’t get built because it’s too expensive, or it can’t get approved, or the process is too slow. So the US builds huge numbers of single family homes and comparatively few multifamily buildings, because it makes the former easy to build and the latter much harder. And it builds huge numbers of homes in Texas and the south, and few in California, because California has made it extremely hard to build homes and the south makes it easy.
Ultimately, I think that housing policy and construction costs are two blades of a scissor. Being able to build inexpensive housing starts with being able to build housing at all, and being able to build densely on valuable urban land. But because construction costs are such an overwhelmingly large part of almost all housing costs, reducing housing costs will require reducing construction costs as well.
New York and San Francisco are anomalies
One thing I feel is important to glean from this is that New York and San Francisco are very non-central examples with regards to housing. These two cities are outliers in both regulatory burdens and construction costs, and the bay area especially has unusually high costs of housing compared to the rest of the country.
Which is not to say that housing policy for these cities isn’t important - it’s of course hugely important, both for the cities themselves and the country as a whole (since they’re critical economic engines [8].) But they should not be reference examples for considerations about broader housing policy, and they should not be the only two cities on your graph when comparing the US to other countries.
(I actually think this is a problem for construction startups, that they’re likely to over-index on the inefficiency of San Francisco construction, and run into problems when they expand to places where construction is cheaper and easier, which is basically everywhere else.)
Recent trends
One final thing to note is that this data is largely pre-pandemic. And as anyone who has shopped for a house recently knows, the pandemic has made the real estate market extremely chaotic. Home prices are way up, as are materials and construction costs. Completion dates are getting pushed out due to supply chain issues, and inventory has been unusually low in the face of a huge demand spike as people shifted to working from home. I think the jury is still out on whether this is a fundamental shift in residential real estate and housing construction, or if it’s a temporary deviation that will eventually correct itself, but it’s something to consider.
Conclusion
So, to sum up:
Supply limitations on housing will mostly show up as increases in land prices.
For existing housing, land fraction makes up on average around 30-40% of the value of a house (though much of this data comes from single family homes.)
For new construction, both single family and multifamily land fraction tends to be 20% or less. 50-80% of the cost of new housing is due to the costs of construction, depending on what you count as construction cost. Construction cost is thus the majority of cost for most new housing construction.
In regions or time periods of extremely high demand, home prices can get bid up well in excess of the cost to produce them, though new construction seems more resistant to this (suggesting that the rate of new building is an important consideration factor in housing prices.)
New York and San Francisco are not representative of the US housing situation overall.
These posts will always remain free, but if you find this work valuable, I encourage you to become a paid subscriber. As a paid subscriber, you’ll help support this work and also gain access to a members-only slack channel.
Construction Physics is produced in partnership with the Institute for Progress, a Washington, DC-based think tank. You can learn more about their work by visiting their website.
You can also contact me on Twitter, LinkedIn, or by email: [email protected]
[0] - A subset of this argument is whether these sorts of restrictions do in fact cause higher housing prices.
[1] - For instance, in the New York Times article linked above on housing costs, both San Francisco and New York are mentioned twice, but there’s no mention of any city in Texas or Florida, the 2nd and 3rd most populous states, and the two states building the most new housing. In the WSJ article, New York and San Francisco are the US cities chosen as comparisons with Toykyo.
[2] - Though they will be linked - a difficult site will result in higher construction costs, and thus might be less valuable than a flatter piece of land.
[3] - This is, for instance, how the Federal Reserve calculations land value, as well as most academic work.
[4] - I wasn’t able to find any more recent estimates for hedonic value of land by metro area. Since the calculated value had such a great deal of variance (it ranged from $0.13 per square foot at the low end to $4.10 per square foot at the high end), it will probably change significantly depending on local economic conditions, above and beyond simple inflation adjustments. So take this with a large grain of salt (though also see the end of note [6]).
[5] - It may also be limited by other things, such as geographic factors [research goes here]
[6] - Based on this table:
0.531 * $418,890 = $222,430
These numbers aren’t all that different than if you did a simple inflation calculation and used modern land prices.
[7] - We don’t see much of a relationship between median lot size (pulled from here) and regulatory burden (and the relationship is once again driven by New York and San Francisco:
[8] - A 2017 study estimated that US GDP would be close to 9% higher if there were unrestricted new housing construction in San Francisco, San Jose and New York.
Subscribe to Construction Physics
By Brian Potter · Hundreds of paid subscribers
Why buildings are built the way they are.
I think one way you could summarize this is that the less distorted the housing market becomes, the more housing prices will converge on construction costs, and therefore the more construction costs will matter. For example, I think falling airfares over time have a lot to do with Boeing and Airbus coming out with cheaper and more fuel efficient planes, and that filters through to airfares because the airline industry is so competitive. I would bet that this was less true pre-deregulation, when the government set prices and supply. I think the focus on loosening supply restrictions in the high priced / supply-restricted market is because high prices indicate that's where the unmet demand really is and so that's where you can get the most impact from any intervention (policy or technological). It's true that there isn't much construction there today but it's hard to do a static analysis because everything is so distorted. Like if you ramped up construction in bigger cities, that would have to reduce construction in the Sunbelt exurbs, or cause people to move out of the cheapest cities, or cause new household formation, or a combination, because you have a fixed number of people to house. |

Thank you. Which comes first? The land value before construction or the size of the construction? Urban development would typically build smaller homes because of the high cost of land. Yet we dont build these smaller homes on lower cost land, we build homes to the maximum size on lower cost land. If we were to happy in smaller homes on lower cost land we could reduce housing costs. But the factors that may drive housing cost is not housing costs but external factors such as families and mobility. example, do I have kids that need a school or do I need to commute an hour to my job. However external factors dictate the cost of construction. Salary and banks. I would guess most people max out their lending, not right size the home they need. As long as incomes go up, and the bank lending % stays the same then housing prices will go up because this is the limiting factor Ref: https://www.ratehub.ca/mortgage-affordability-calculator The rule of thumb is you can afford a mortgage where your monthly housing costs are no more than 32% of your gross household income, and where your total debt load (including housing costs) is no more than 40% of your gross household income. This rule is based on your debt service ratios Total Income USA: |


 Publish on Substack