"Too many of us look upon Americans as dollar chasers. This is a cruel libel, even if it is reiterated thoughtlessly by the Americans themselves."
-- Albert Einstein
**Commission NOTICE**
Labels
- annuities (14)
- anti-frugal (47)
- automotive (125)
- blogs (12)
- bonds (21)
- books (15)
- budgeting (30)
- career (37)
- charity (4)
- children (8)
- college (118)
- computer (24)
- credit cards (81)
- credit report (22)
- devils-advocate (6)
- eating out (41)
- ebates (85)
- economy (158)
- education (9)
- energy (33)
- energy savings (85)
- entertainment (63)
- estate planning (5)
- freebie (118)
- frugal (301)
- gardening (4)
- gold (22)
- guestpost (2)
- health (33)
- historical (94)
- home (33)
- income (26)
- insurance (76)
- investing (78)
- jobs (79)
- low income (22)
- marriage (10)
- math (21)
- net worth (49)
- news (20)
- opinion (82)
- personal (39)
- pets (10)
- planning (8)
- real estate (155)
- rentals (85)
- retirement planning (108)
- review (13)
- ROI (9)
- shopping (177)
- stocks (53)
- taxes (104)
- travel (46)
- unemployment (15)
- updown (42)
- weekly roundup (356)
February 16, 2011
Distribution of Home Sizes in the US
You may often hear something in the press like "the average new house is now 2,400 sq. ft". This might lead us to believe that a 'typical' or 'average' house is 2,400 sq ft. right? Well no. The key word there is "new house". New houses are larger than old houses. The median house size in the USA is currently 1,800 sq. ft. Since that is the median, that means that half the houses out there are less than 1800 and half are more than 1800. Thats a lot less than 2,400.
The census has data on houses. The American Housing Survey for 2009 has all sorts of data on housing in the US. I looked specifically at table 3-3 'size of unit and lot' to get the data below on current home sizes.
Graphically the distribution of home sizes for owner occupied houses looks like this:
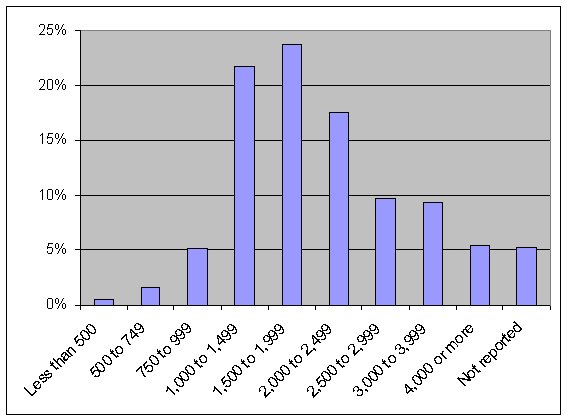
Note that the far right item covers 5.3% of home sizes that were 'not reported'.
Lets chop the data up and look at it a few ways:
45% of homes are between 1,000 and 1,999 sq. ft.
41% of homes are between 1,500 and 2,499 sq. ft.
63% of homes are between 1,000 and 2,499 sq. ft.
72% of homes are between 1,000 and 2,999 sq. ft.
7.3% of homes are less than 1,000 sq. ft.
14.8% of homes are over 3,000 sq. ft.
Here is the data in table format:
| Less than 500 | 383 | 0.6% |
| 500 to 749 | 1,085 | 1.6% |
| 750 to 999 | 3,519 | 5.1% |
| 1,000 to 1,499 | 14,978 | 21.8% |
| 1,500 to 1,999 | 16,284 | 23.7% |
| 2,000 to 2,499 | 12,057 | 17.5% |
| 2,500 to 2,999 | 6,622 | 9.6% |
| 3,000 to 3,999 | 6,391 | 9.3% |
| 4,000 or more | 3,787 | 5.5% |
| Not reported | 3,638 | 5.3% |
| Total | 68,742 |
I'm only looking at owner occupied homes. So this does not include rental properties.
Currently our house falls roughly in the middle at about 1,400 sq. ft. We're looking into getting a bigger home eventually.
Email this • Technorati Links • Save to del.icio.us • Digg This! • Add to Tip'd

Subscribe To
Useful Links
Featured Post
Changes in Incomes from 1960 to 2014
TheBigPicture shared a link to an article Shifting Incomes for American Jobs from Flowing Data site. I of course got excited, because I m...
Popular Articles
- Step by Step guide to Get Your Free Annual Credit Report
- What Do Annuities Cost and What Benefit do they provide?
- Use CreditCardTuneUp.com to find good Rewards Credit Cards
- What does home maintenance really cost?
- Don't Waste Money On Overpriced Infrared Heaters
- How Much Do People Spend on Clothes?
- How much should you spend on an engagement ring?
- Historical price of silver
- Teacher Pay vs Median Incomes by State
- How to adjust for inflation?
- Number of Millionaires by State
- Home foreclosure rates past and present
- Historical prices of gold
- Historical rates for corporate AAA bonds
- Can you get a cell phone for $5 a month?
- Historic Unemployment data
- More on historical home appreciation
- How to calculate annual percentage growth
Archive
-
▼
2011
(353)
-
▼
February
(28)
- $686 in Credit Card Rewards
- Deducting Sales Tax from Your Federal Income Taxes
- Best of blog posts for week of February 25th
- 3 Myths About the Governments Inflation Measure, o...
- Careers Headed for the Trash Pile
- How Many Jobs Actually Require College?
- Jobs You Never Knew Were So Dangerous (and maybe a...
- Best of blog posts for week of February 18th
- One Year To a New Career (kinda, maybe)
- Employment by Industry as % of total from 1961 to ...
- Distribution of Home Sizes in the US
- Americans do NOT spend $163 billion Preparing Taxes
- By Owner Rentals : Refundable or Non-refundable? ...
- Best of blog posts for week of February 11th
- 10 Mortgage Mistakes to Avoid
- Reject Mini-Tender for GE or Adobe Stock or Any Ot...
- How Much Do 401k Fees Cost?
- Average Auto Insurance Costs by State
- FREE - $2 in MP3 downloads from Amazon
- Why Your Landlord May Charge Lower Rent than Buyin...
- Trend in Home Loan Delinquency and Foreclosure Rates
- Best of blog posts for week of February 4th
- Please Vote for my Article on the Free Money Finan...
- We're #2!! We're #2!! We're #2!! ... Except we'...
- Surviving on Minimum Wage? : An Example Budget
- Updown Performance : January +0.1%
- Net worth Update : January 2011 + $7,993
- Sources of State Taxes
-
▼
February
(28)
Personal Finance Blog Roll
![]()