Brilliant Jerks, Crazy Hotties, and Other Artifacts of Range Restriction
When people write about Steve Jobs, they mention that he was brilliant but caustic: he could instantly solve design problems that had bedeviled his team for months, but he’d summarily fire people for minor mistakes. Since a lot of people want to be like Steve Jobs, and since being a genius is hard, some ambitious people play up their jerky behavior.
But Jobs was an outlier in many ways. Was he an outlier this way, too?
The boring answer is yes: there is not a strong relationship between IQ and agreeableness, so to the extent that it’s scientifically possible to ask if smart people are jerks, the answer is "no more than average."
The jerk-genius correlation isn’t the only folk correlation, of course. There’s the hot-crazy scale, the jock/nerd dichotomy, and more. Beauty and mental stability should, if anything, correlate slightly better, since sufficiently crazy people have trouble with basic hygiene, and mutational load affects both facial symmetry and mental illness. Being a jock and being a nerd do empirically correlate, as exercise is a nootropic and smart people are healthier. Empirically, the meathead/pencil-neck continuum is actually an incredibly unfair continuum between healthy/smart people an unhealthy/dull ones.[1]
So why is it that we have so much folk wisdom about the tradeoffs between traits, when those tradeoffs don’t, broadly, exist?
The answer isn’t surprising; it’s just statistics. To a first approximation, any strong negative correlation between desirable traits is driven by range restriction.
Let’s Test It
The intuition is simple: if you’re looking at how traits A and B correlate, but you’re only looking at a subset of people, and that subset is determined by people’s levels of A and B, the correlation within the subset will be lower than the correlation outside of it.
Consider standardized test scores and GPAs, two different ways of measuring academic aptitude. In the aggregate, it makes sense that they correlate well: if you got perfect scores on the SAT, you probably did ok on other tests, too; if you struggled on one, you struggled on both. But colleges look at both in combination because they measure different things. The SAT is a better measure of raw reasoning ability; GPA is also a measure of how hard you’re willing to work. If schools admit students based on their GPA and SAT, the positive correlation goes away within a given school: the high-SAT students have lower GPAs, and vice-versa.
We can simulate this.
We’ll start by generating a bunch of hypothetical students; we determine everyone’s GPA by taking their SAT score’s standard deviation and applying some noise:
import pandas as pd
import numpy as np
import scipy.stats
import matplotlib.pyplot as pltdef gen_students(noise=0.5):
    """Create a set of students with a hypothetical GPA and SAT distribution"""
    scores = np.random.normal(1000,195,100)
    scores = [400 if x < 400 else 1600 if x > 1600 else x for x in scores]
    zs = scipy.stats.zscore(scores)
    gpas_raw = [3.0 + # median GPA
                x * 0.75 # GPA std dev
                + np.random.normal(0, noise) # some normally-distributed noise
                for x in zs]
    gpas = [0 if x < 0 else 4.5 if x > 4.5 else x for x in gpas_raw]
    df = pd.DataFrame(list(zip(scores,gpas)), columns = ['SAT','GPA'])
    df['GPA_Percentile'] = df.GPA.rank(pct=True)
    df['SAT_Percentile'] = df.SAT.rank(pct=True)
    df['Ranking'] = (df.SAT_Percentile + df.GPA_Percentile) / 2
    return df
If we run df['SAT'].corr(df['GPA']), we see that the correlation coefficient is 0.80. In other words, SATs and GPAs are tightly correlated.
Now, let’s send these kids to school:
def choose_schools(df, count=10):
    quantiles = pd.qcut(df.Ranking, count)
    key = dict(zip(list(quantiles.cat.categories), range(10)))
    df['Quantiles'] = pd.qcut(df.Ranking, count)
    df['School'] = [key[x] for x in df.Quantiles]
    return df
All this does is divide the students into cohorts based on their SAT percentile + GPA percentile. I’ve just numbered the schools from 0 to 9. School 0 has a mean SAT score of about 700 and a mean high school GPA of 1.6, while school 9 has an average SAT of 1325 and a mean GPA of 4.15.
But what’s really interesting is the result of looking at SAT/GPA correlations within schools. We can run this fast with:
for i in range(10):
    print(df[df['School']==i]['GPA'].corr(df[df['School']==i]['SAT']))
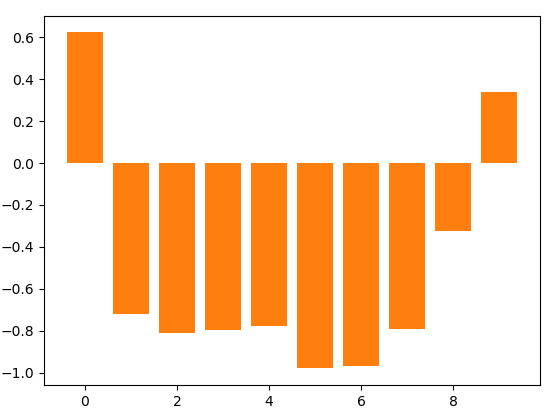
For most schools, the correlation is strongly negative. For example, at school #5, there’s a -0.98 correlation between GPA and SAT. Here’s the overall summary:

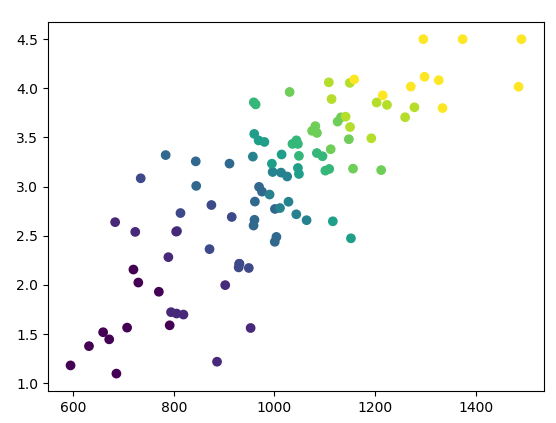
And a visual representation of the students, color-coded by school:

One notable feature of this plot is that, at the high end and the low end of the range, the correlation is closer to the real-world correlation. This is a partly a function of the distribution I used, because there’s a ceiling for SATs and GPAs. But that is a reflection of the real world. Some traits are trivial to measure, like height, but there’s serious disagreement over exactly what SAT scores and GPAs are even measuring. (Is GPA a measure of how hard you work, or how willing you are to work hard on pointless tasks? Does the SAT measure how smart you are, or how good you are at taking multiple-choice tests? In the middle of the distribution, it’s easy to generalize, but at the extremes the tests are imperfect.)
The upshot of all of this is that, if you’re at an extreme on some distribution — attending Harvard, at the Olympics, on Death Row — the absolute floor and ceiling of our measurements mean that the sample is actually less subject to range restriction. The rest of us, though, have to be keenly aware of range restriction.
Using Range Restriction
One happy result of this is that it gives you a better way to handle imposter syndrome. Probably, whatever you’re good at is less visible to you than what you’re bad at. "Everyone is smarter than me!" you think, at the company where everybody is blown away by your work ethic. "Everyone here has better time-management skills than I do," says the smartest person at the company. "Everyone works harder than me and is vastly smarter, too," says the most socially adept person at the office.
In fact, the only people who should feel imposter syndrome are the ones whose strongest skill is selling themselves. But since selling yourself entails some self-deception, they are, naturally, the ones who think they’re surrounded by lazy idiots.
Another takeaway is that if you’re in a group that’s aggressively sorted by one metric, but accomplishment within the group relies on other metrics, those metrics will be the only ones that predict success post-sorting. So at top tech companies, STEM expertise is the least predictive measure of success, but only because they’re already conditioning hiring on being among the world’s STEM experts. (The darker takeaway is that "people skills" are something sociopaths have in spades; one way to be considered an effective leader is to take credit for things that go well and to efficiently shift blame for things that don’t. Suddenly, everything you "led" was successful!)
The main conclusion you should draw from range restriction, though, is that the people you interact with are not a representative sample, but the obvious statistical tools — both the formal ones and informal observations — implicitly assume a random sample.
There are kind-hearted people with incredibly sharp minds. There are beautiful people who are also mentally stable. But for the vast majority of us, those people are so out of our leagues as to be invisible. As software eats the world, it has gotten far easier to sort people based on their observable characteristics, so you’re increasingly surrounded by people who are, in the aggregate, about as good as you are by whatever version of "good" is most amenable to number-crunching.
If you worked at the best company in your industry, or were in the most exclusive possible dating pool, you’d see that the correlation between good traits is generally positive. If you don’t, bad news: you’re not 99.99th percentile. You can be zen about this, though: if you’re not among the best in the world at what you do, and you observe tradeoffs between desirable traits among your peers, at least you know the world is pretty fair.
Don’t miss the next story. Sign up for my occasional email newsletter. Or check the About/FAQ page for more.
[1] Of course, there’s lots of variability in both cases; I’m talking about extremely broad averages, not anything that would apply meaningfully to any one person. Additionally, these generalizations are hard to make because people often choose personality traits to exaggerate. It’s hard to be memorable as someone who is a little bit above-average in lots of different ways, so the usual pattern is to really go all in on one or two traits.

