An inverted yield curve: why investors are watching closely
Bond markets are flashing a warning signal about the growth prospects for the US economy, just as central bankers prepare to tackle soaring inflation with higher interest rates.
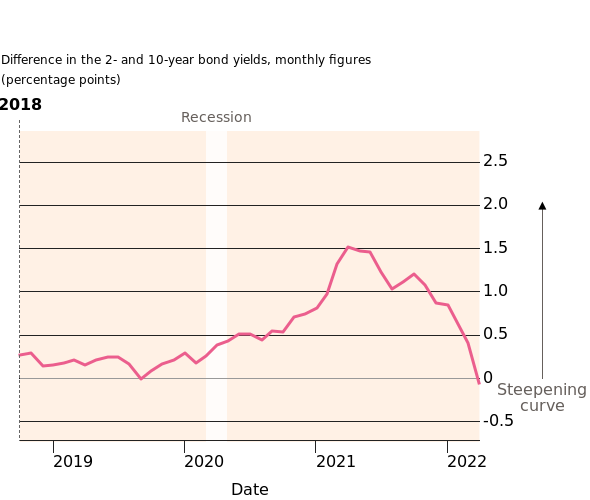
The gap between long-term and short-term government borrowing rates in big developed economies has narrowed drastically since the autumn. In the US, a so-called "yield-curve inversion" occurred last week for the first time since 2019 - an event that in the past has been the harbinger of economic downturns.
"Historically, a US recession tends to follow a year after the curve inverts, though the variance is large and there are occasional false positives," said Priya Misra, head of global rates strategy at TD Securities.
What is a yield curve?
Investors do not have a crystal ball, but the yield curve is the next best thing.
The yield curve shows the interest rates that buyers of government debt demand in order to lend their money over various periods of time — whether overnight, for one month, 10 years or even 100 years.

Because lending to governments in large developed economies such as the US, Germany, Japan and the UK is considered a safe bet, these borrowing rates are mostly influenced by investors’ assessment of the prospects for economic growth and inflation, and how those in turn will affect central bank interest rates.
The US yield curve in particular — thanks to the central position of the dollar in the global financial system — acts as a kind of barometer of investors’ collective wisdom about the future path of the world’s largest economy, and has a strong record in signalling downturns before they arrive.
"People get excited about the yield curve because, historically, it has been a good predictor of the onset of recession," said Richard McGuire, a fixed income strategist at Rabobank.
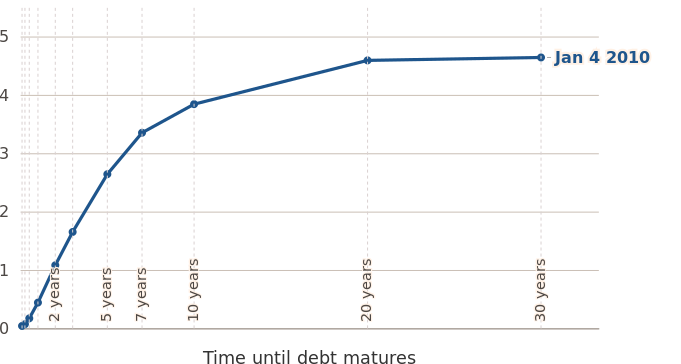
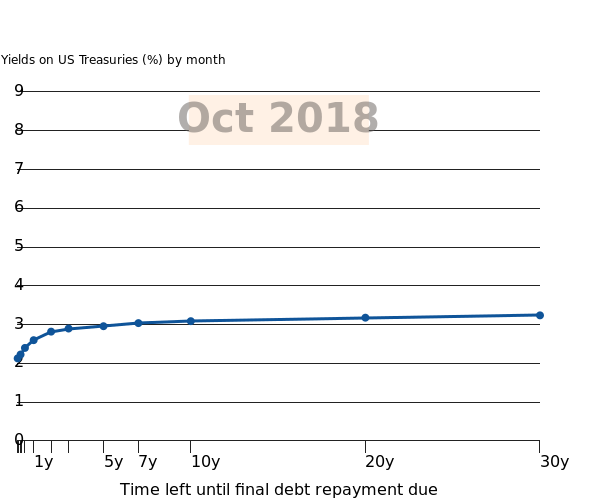
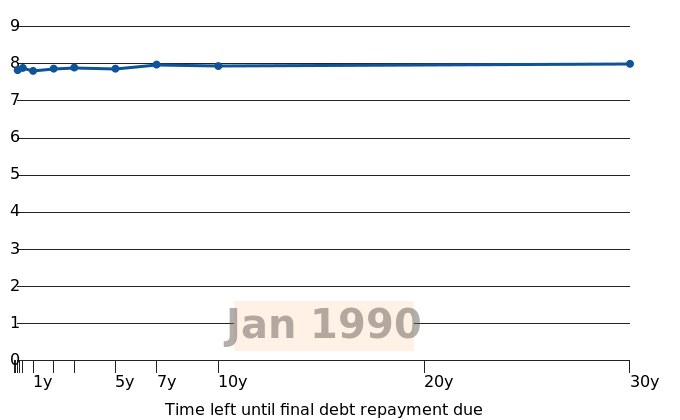
The yield curve is usually upward sloping, whereby a higher fixed rate of return is earned from lending money for longer periods of time. Shorter-term yields tend to represent what investors believe will happen to central bank policies in the near future. Longer-dated maturities represent investors’ best guess at where inflation, growth and interest rates are headed over the medium to long term.
However, when an economy is slowing, and inflation expectations decline, yields on 10- and 30-year bonds typically fall towards those of shorter maturities, such as three-month and two-year notes as bond buyers bet there is less need for central banks to raise borrowing costs in the future; instead they may need to encourage spending.

This so-called flattening in the yield curve can at some point become a recessionary signal, in particular if the curve becomes downward-sloping or inverted, as happened last week. An "inversion" of the yield curve has preceded every US recession for the past half century.
There are two possible explanations for this predictive power, McGuire explains. One is that trading in the $23tn US government bond market serves as a kind of early warning system, identifying approaching dangers that individual forecasters struggle to spot. The other is that shifts in the shape of the yield curve play an active role in triggering downturns by undermining confidence in the economy.

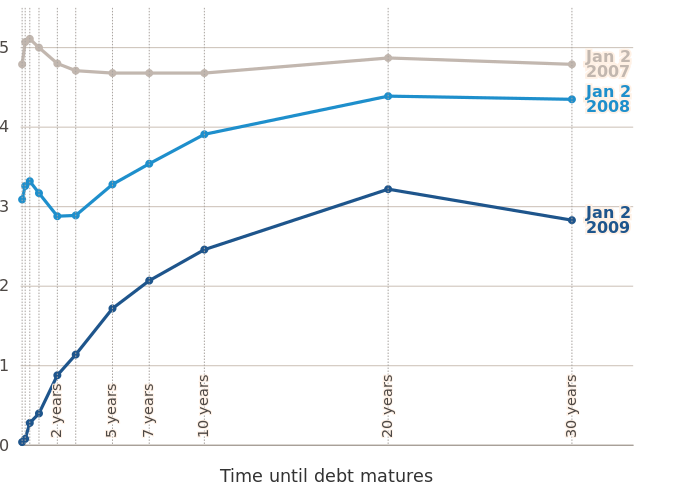
During periods of economic expansion and very accommodative monetary policy, where governments use low interest rates to encourage spending and boost economic activity, the yield curve steepens. This occurred following the 2008-09 financial crisis and early last year, after the pandemic recession.
The rationale for such a shift is that bond investors expect higher yields in the future, because a stronger economy may spur a faster pace of inflation if demand in the economy starts to outstrip supply of goods or labour. In this scenario, the central bank will eventually need to set higher overnight interest rates to encourage people to save more, rather than spend.
Listening to the yield curve helps draw attention to key points in the data, such as notes descending along the curve indicating that it has inverted. It also takes the data to new audiences, helping those who may not be able to see the charts hear them instead.
What’s been happening with the yield curve more recently?
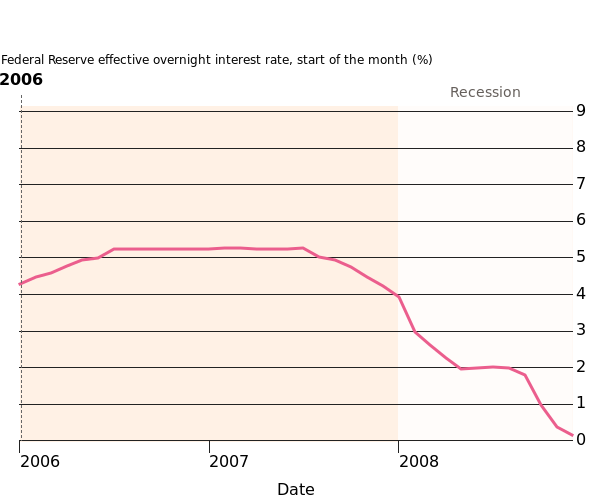
The latest inversion of the yield curve - where the two-year yield last week rose above the 10-year yield - came as investors worry that a rapid series of rises in interest rates by the Federal Reserve could cause a sharp economic slowdown.
The US central bank lifted borrowing costs for the first time since 2018 last month, and is expected to do so by a further 2 percentage points in the remainder of the year as it grapples with the highest inflation rates in decades.
Russia’s invasion of Ukraine, which sent commodity prices spiralling higher, has added to the inflationary pressures faced by the Fed and its counterparts around the world. However, soaring energy costs are also expected to sap growth rates, raising questions about how high the Fed can push rates before it has to stop. In effect, the inversion of the curve implies that some investors think that, after a period of rapid tightening, the Fed will be forced to reverse course.
Some analysts have highlighted that the gap between three-month and 10-year borrowing costs – another closely watched indicator – is yet to turn negative, largely because the three-month yield reflects the still-low level of interest rates today. If the Fed follows the course plotted by markets over the coming months, that "spread" is likely to turn negative as well.
When the yield curve last inverted in 2019, it prompted fears that the long economic expansion following the global financial crisis was drawing to a close.
As it turned out, a recession did follow, when the Covid outbreak prompted a shutdown of huge swaths of the global economy. Even the yield curve’s most avid proponents do not claim it can forecast pandemics. Still, we will never know if the US was poised for a downturn anyway, and the predictive power of inversions preserved its strong track record. That is one reason why investors have been watching recent shifts in the shape of the curve so closely.
Even so, some sceptics say that Fed bond-buying — along with quantitative easing programmes from other central banks around the world — has muddied the yield curve’s predictive powers.
The Fed’s $120bn-a-month of purchases – which ended last month – were designed to lower longer-dated yields; higher demand for bonds raises prices and lowers the potential yields to be gained on these assets. The quantitative easing programme resulted in the central bank owning 28 per cent of the Treasury market, according to Misra.
"While markets have become nervous about what a yield curve inversion means for economic growth in the future, it is worth recalling that [quantitative easing] has likely distorted the signalling power of the yield curve," she said.
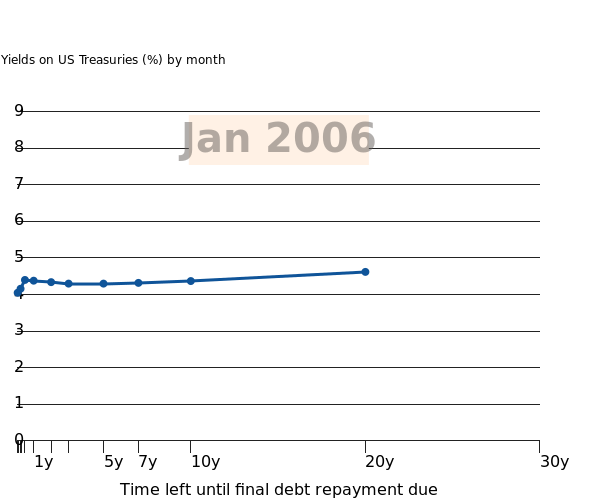
Explore for yourself: hear how investor expectations played out through the US yield curve
Yields on US Treasuries (%) by starting from
We would love to learn about your experience interacting with this story. If you would like to leave feedback, please visit our survey.
Sources and notes: US Treasury, *The 20-year bond was reinstated in 1993 after being halted seven years earlier due to a lack of buyers: pension plans preferred a longer 30 year maturity, while 20 years was too long for investors who preferred 10 year debts **Following the 9/11 terrorist attacks, the Treasury paused sales of 30-year bonds after deciding to sell more debt with shorter maturities and lower yields; this decision was reversed in 2006 when the Federal deficit had ballooned
Visual Storytelling Team: Caroline Nevitt, Ellen Davies, Sam Joiner and Steven Bernard. Based on Sonification: turning the yield curve into music by Alan Smith
Bonds are (sort of) back
Why it’s comeback time for the 60:40 strategy
Pimco says buy bonds (please)

Treasury bails out BoE for first losses on QE programme
Treasury official proposes plan to make more bond-trading data public

The cracks in the US Treasury bond market
US stocks record best day in over 2 years on cooler inflation data

Treasuries probably aren’t the next crisis

The Financial Times and its journalism are subject to a self-regulation regime under the FT Editorial Code of Practice.