60 Years of Homebuilding
constructionphysics.substack.comTo a first approximation, every housing unit that gets built in the US is required to have a building permit - a document from the government granting permission to build it. The number of homes built is considered an important economic indicator, and the government closely tracks housing permits as a way to measure it. We have month-by-month housing permitting data for individual counties going back to 1980, and state-level permitting data going back to 1960. Permits issued don't precisely track homes actually constructed, but it’s a very close match. Using this permit data, we can construct a very granular picture of exactly how home construction has proceeded in the US for the past 60 years.
Permitting data can be pulled from a few different sources. For national level data I’ll use FRED housing statistics, for state-level data I’ll use the Census Building Permits Survey, and for county and metro-level data I’ll use HUD’s SOCDS Permits Database.
Homebuilding in 2020
We’ll start with the 10,000 foot view. In 2020 there were 1.47 million housing units permitted in the US, 1 million of which were single family homes (the rest were some type of multifamily construction such as duplexes, apartments or condos). There are just under 140 million housing units in the US, so the US added roughly 1% to it’s housing stock last year (ignoring homes that were removed from the housing stock). These housing units are overwhelmingly built using light framed wood construction - 90-95% of single family homes and 70% of multifamily units consist of light framed wood.
But new home construction isn’t distributed evenly - it’s highly clustered in certain parts of the country. The graph below shows the number of permits issued for each state, organized by Census region.

We see that three states, Texas, Florida, and California, are huge outliers in terms of number of homes built. Combined they’re responsible for over 33% of new home construction in the US. Of these, Texas is the biggest builder - it issued 230,000 housing permits in 2020, 15% of the entire US.
Looking at it by Census region, we see that home construction is overwhelmingly concentrated in the South and the southwest [1]. The South collectively issued 778,000 permits in 2020, just over 50% of the entire US. Add in California and Arizona (106,000 and 60,000 respectively) and that goes up to 66%. The Northeast and Midwest, on the other hand, build much less. Texas alone builds more homes than both the entire Northeast (134,000) and the entire Midwest (202,000). The Northeast in particular looks grim - New York is the home of the largest city in the US, but builds only slightly more homes than Utah [2]. Pennsylvania builds half as many homes Tennessee does, despite having twice the population.
Number of permits gives us a sense of where most construction is occurring, but doesn’t tell us which states are building the most proportionally. So let’s look at building permits per capita:
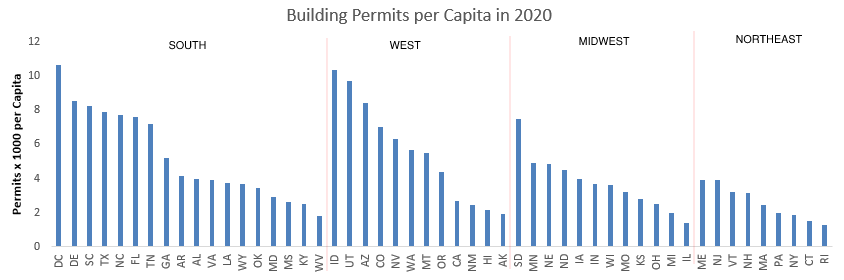
The South still looks strong, but we also see the West building at high rates. States like Idaho, Utah and Arizona actually build at proportionally higher rates than Texas. California’s building rate, on the other hand, is actually on the lower end of the scale.
The Midwest, while not building nearly as much as the South or the West, doesn’t look so bad on this metric - who knew South Dakota was having a building boom. But the Northeast still looks grim - on a per-capita basis, New York and Pennsylvania build fewer homes than Alaska.
So far these numbers have remained somewhat abstract - I haven’t shown any data mapped because it tends to be distorted by the physical size of a state’s land area. But if we drop down to county level data, we can get a pretty good view of exactly where homes are built in the US:
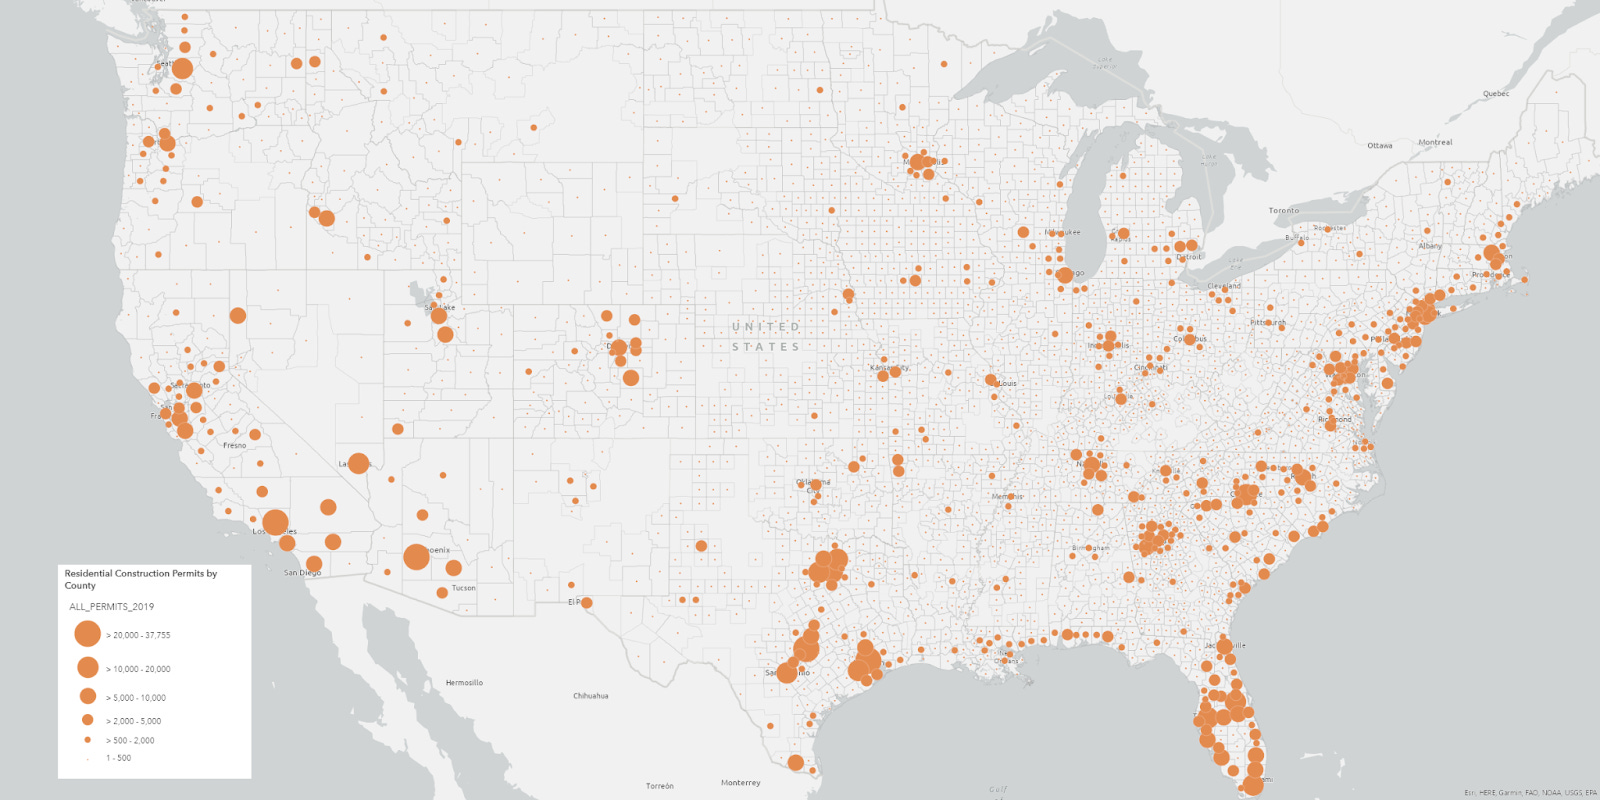
Perhaps unsurprisingly, we see that home construction is mostly concentrated in a few large metro areas [3]. Over 75% of new homes in Texas, for instance, are built in Houston, Dallas, or Austin. The same is true for most of the other high growth states - most of the building in Nevada is in Las Vegas, most of the building in Arizona is in Phoenix. Same for Washington/Seattle, Utah/Salt Lake, Colorado/Denver and Idaho/Boise. The exception to this is Florida, which sees construction spread all over the peninsula - Florida has 9 of the 100 largest metro areas in the country compared to Texas’ 6, despite having a lower population. California and North Carolina also show a slightly more diffuse pattern of building.
We also see that the NYC metro doesn’t look quite so bad in terms of raw numbers, especially if you ignore state boundaries and census categories, and consider New York-DC-Baltimore-Philadelphia as a single huge metro. But it still can’t hold a candle to the high growth states. Those 4 metro areas combined (34 million people) issued 105,000 permits in 2020. For comparison, North Carolina (10.5 million people) issued 80,000, and Houston alone (7.1 million people) issued over 70,000.
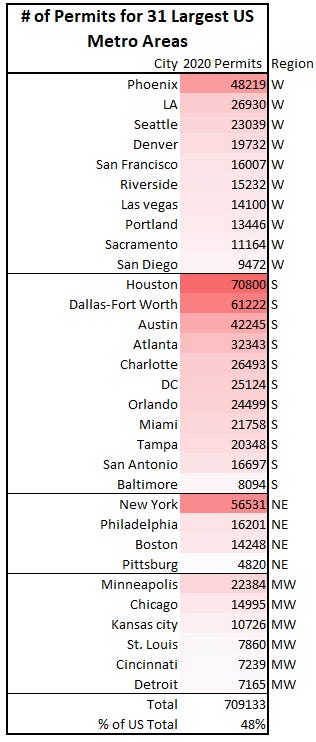
There’s a few other interesting trends to pick out as well. Despite the riots in Minneapolis, it permitted more homes than Miami, Chicago, Philadelphia, San Diego, and Boston, and only slightly fewer than LA. And though moving to Austin has become a meme at this point, I’m not sure if folks outside the city are aware of the scale of the building that’s occurring. Austin permitted over 42,000 housing units in 2020, more on a per capita basis than any other metro in the country, and fifth overall in raw numbers despite being the 29th largest city in the country. More homes were permitted in Austin last year than in Los Angeles and Chicago combined.
Homebuilding: A History
So that’s the state of US homebuilding in 2020. Now let’s look at previous years’ permit data, to get a sense of how homebuilding has proceeded over time.

The graph above shows total housing starts for single family (blue), multifamily (red), and manufactured (orange) homes [4]. We see a few interesting trends:
Unlike most graphs of US economic indicators, this one doesn’t go up and to the right - smooth out the fluctuations, and homebuilding has remained at a similar level for 60 years. We actually build fewer homes today than we did in 1959.
Homebuilding fluctuates an enormous amount from year to year. During a recession, building rates can drop by 2/3rds or more. After the financial crisis, we can see that homebuilding rates dropped by 75%, and have been on a long slow recovery since then.
In some ways, the last 10 years have been somewhat unusual, as homebuilding has continuously trended upward - a reprieve from the normal boom-and-bust cycle that’s more typical of home construction.
Outside of a few brief windows (early 1970s, early 1980s, late 2000s) multifamily housing starts never come anywhere near single family. The US is and has been a nation of single family homes.
Manufactured homes peaked as a share of construction around 1973, after which sales collapsed and never recovered. Manufactured home sales occasionally approach multifamily construction in terms of popularity, but are currently near historic lows.
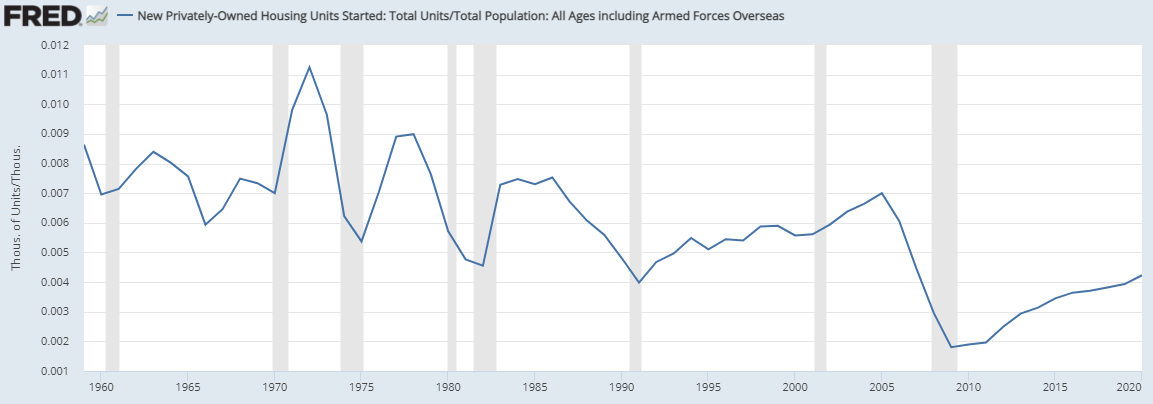
The current homebuilding rate of 1.47 million per year is actually fairly close to the 60 year average of 1.35 million per year. But the picture changes if we look at permits per capita. We see the same basic graph as above, but kinked downward. On this metric, current home construction looks anemic - housing starts per capita are roughly at what was previously recession-level rates [5].
We can get an even better sense of past trends by looking at state level data. Below is a graph showing annual building permits for each state, going back to 1960. Once again blue is single family, red is multifamily, and orange is manufactured. Manufactured home data is only shown after 1994, as that's as far as state-level data extends (click to embiggen):
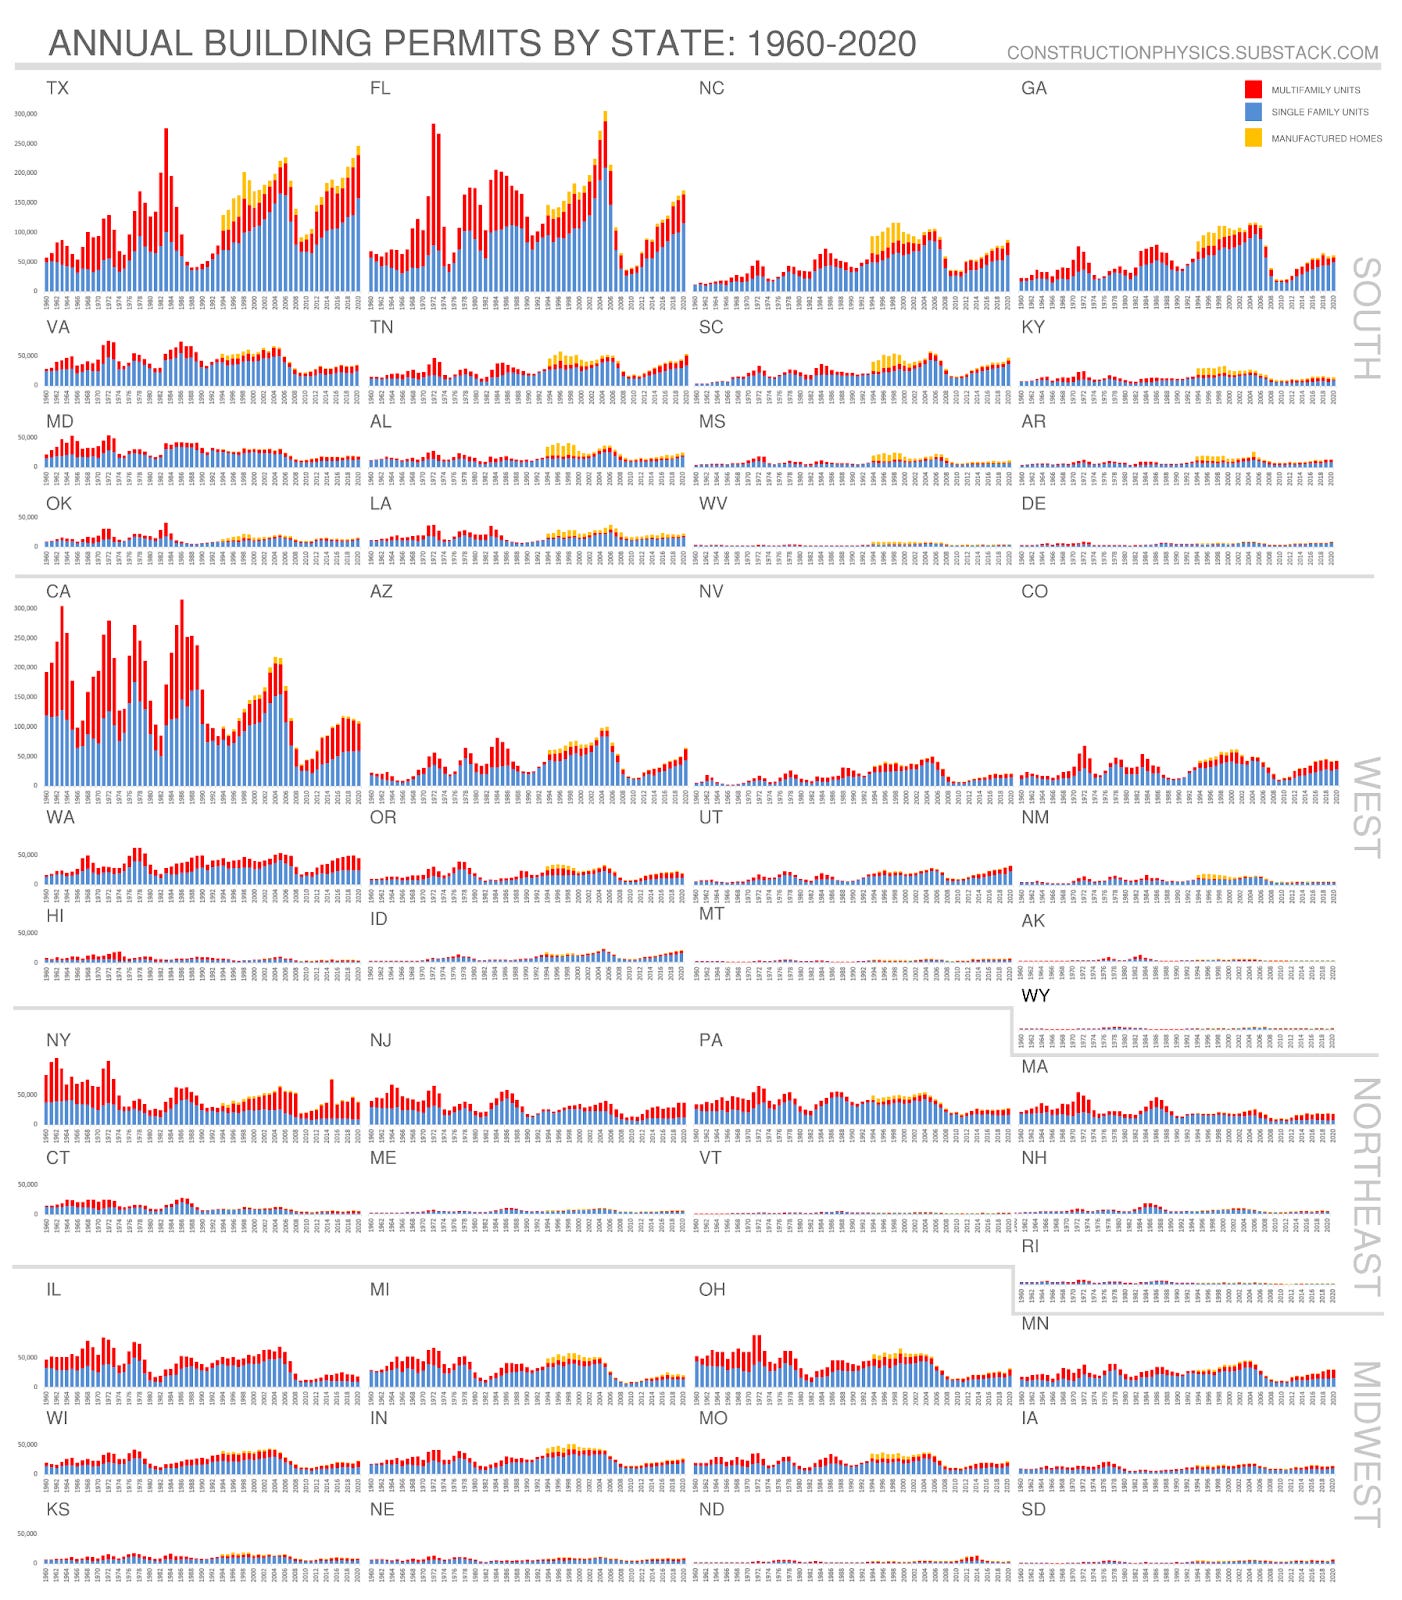
We see that Florida, California and Texas building huge amounts of homes isn’t a new phenomenon. California has been building huge numbers of homes since our data begins in 1960 (it’s actually currently near historic lows), and Texas and Florida since the mid to late 70s. The same is true for most of the other states currently building in large volumes - North Carolina, Georgia, and Arizona’s large permit numbers go back at least to the early 90s.
For the states with low rates of home construction, we can see that many of them were building significantly up until the financial crisis. This is especially true for the Midwest states such as Illinoi, Michigan, and Ohio. Almost no states have completely recovered from the financial crisis (only 5 states - Texas, Tennessee, Utah, South Dakota, and Montana - have surpassed their pre-financial crisis level of building), but Midwest building levels have remained depressed, while the South and the West bounced back much more quickly.
But while sometimes economic conditions can affect all housing markets simultaneously (we see an across the board collapse in the early 70s), it’s also common for booms and busts to vary a great deal by region. Home construction booms in the early 80s in Texas, just as it’s plummeting in New York. A few years later, this would reverse: Texas building levels collapsed in the late 80s, just as they’re spiking in New York and New Jersey. California building levels exploded in the late 60s, but were much more modest everywhere else. North Dakota saw a building boom in 2012-2013 thanks to the rise of fracking. The economic history of every region in the US shows up in the building permit data.
We also see recessions affecting single family and multifamily construction differently. The recession of the early 70s almost completely wiped out multifamily construction, while mostly sparing single family. Multifamily construction dropped in Texas by over 97% between 1983 and 1988, as the Savings and Loan crisis combined with falling oil prices obliterated its housing market. The financial crisis of 2008 was actually somewhat unusual, in that it affected single family construction more than multifamily.
County-level permit data only goes back to 1980, and doesn’t change the story we’ve seen so far. We see the same concentration of building in a few metro areas, mostly the same ones that are being built now: Dallas, Houston, Phoenix, Atlanta, etc. We also see how empty large areas of the country are - around half the country consists of counties that build fewer than 60 homes a year on average.
Using permit rates and average number of occupants per home, we can construct a rough rate of growth for the largest US metro regions. The estimate isn’t incredibly accurate (it differs from actual values by 10% or so), but is good enough to let us spot trends (click to embiggen):
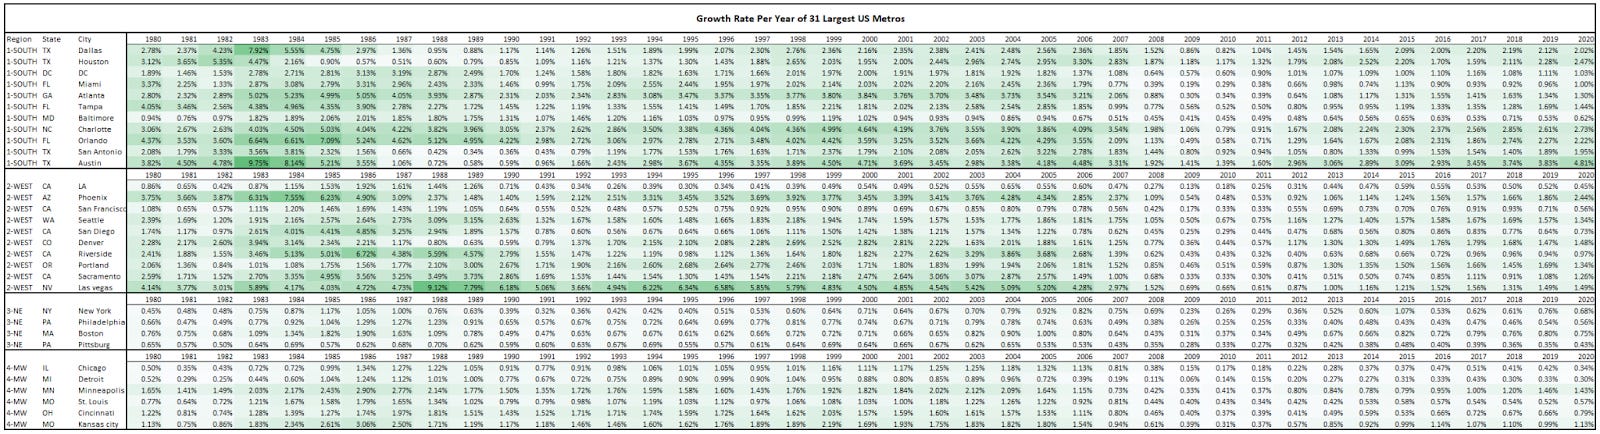
We see that even the fastest growing cities aren’t growing all that much - outside of Austin, no city is increasing it’s housing stock by more than 3% a year. In the early 80s, thirteen of the top 31 cities were building by 3% a year or more, and 6 cities were building by 5% or more.
We see the same low rates of building in the Midwest and the Northeast. Outside of Minneapolis (and Kansas City, interestingly), no large Midwestern city is increasing its housing stock by more than 1% a year. And outside of 2 exceptions (New York in 2015 and Boston in 2005), no large Northeastern city has built by more than 1% a year since 1988.
Interestingly, despite respectable building rates for many California metros, LAs building rate is fairly low. This means that the US’s three largest cities (New York, LA, and Chicago) have among the lowest building rates in the country, perhaps not much higher than the rate homes leave the housing stock .
The real story here is Austin, which is building almost twice as much as the next fastest growing city.
So, to sum up:
Most housing units in the US are built in the South and the southwest, particularly in Texas, California and Florida. This has been the case for roughly the past 40 years. The majority of these housing units are single family homes.
Homebuilding volumes fluctuate a great deal, depending on both national and regional economic forces, but have been gradually trending downward. Relative building rates, on the other hand (which regions are building a lot, which aren’t) tend to be fairly persistent.
The majority of homes are built in large metro areas, but the three largest metro areas (NYC, LA, and Chicago) build comparatively few homes on a per-capita basis.
To some extent, this contrast between regions shouldn’t be surprising - we should expect home construction to have winners and losers. Outside high levels of immigration (and assuming homes aren’t built with extremely short lifespans), a surge in one area will be accompanied by a slump somewhere else.
Drivers of Homebuilding
Can we take a guess as to what’s driving these homebuilding trends?
Obviously the chief influence on home construction is the number of people moving to an area. This will be affected by many factors - as we saw previously, homebuilding is somewhat at the mercy of local economic effects. An oil strike near your city will drive home construction up, a hurricane will drive it down.
But is there some factor that explains why Phoenix, Orlando, and Houston, cities thousands of miles apart and with vastly different economies are all building? We can see a few commonalities between the regions building the most:
They tend to have warmer climates. If we squint, we can actually see this follow the pace of technology. Construction in California (naturally mild climate) dominates up until the 1970s, when construction in the South spikes and in the Northeast plummets, roughly around the same time that air conditioning becomes popular.
There’s a slight tendency towards a lower tax burden. Only 9 states have no state income tax, but 5 of those (Florida, Texas, Nevada, Tennessee, and Washington) are some of the highest growth rate states.
For metro areas, there’s a tendency towards not having geographic barriers (oceans, mountains) that would prevent the city from spreading. Of the 18 large metros with a home construction rate of 1% or more, 12 of them are unencumbered (or close to it) on all sides. This becomes especially important if most of your construction is single family homes, which occupy much more land per unit than multifamily homes.
Those are all suggestive, but there are plenty of counterexamples for each. Can we go deeper?
Let’s look at the hundred largest metro areas in the country, which combined house roughly 2/3rds of the US population. Using 2010 and 2020 Census data, we can get a growth rate for each metro. Does anything correlate with this [6]?
Neither cost of living index or median home price do [7]:

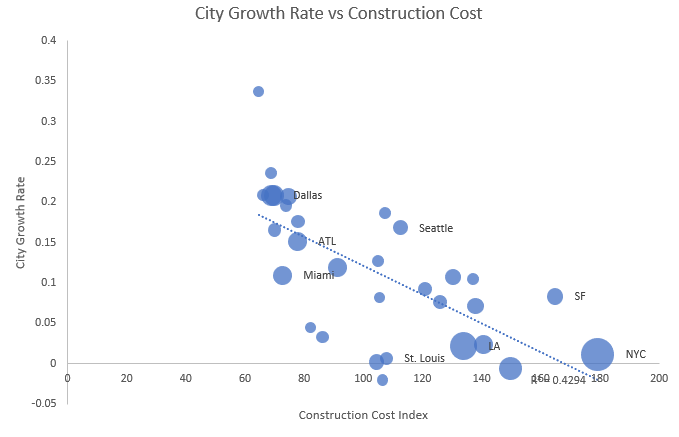
But if we compare growth rate vs construction cost index, we see a modest negative correlation, with an r2 of about 0.2:
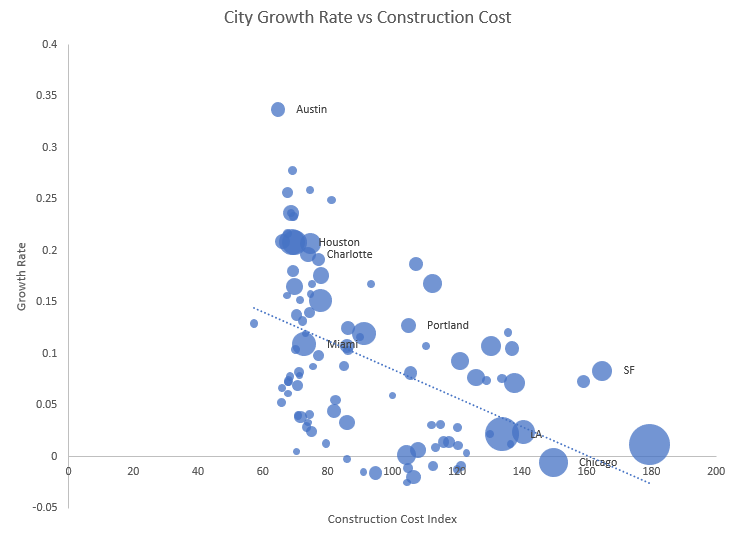
And, this correlation rises if we look at just the largest 30 metros in the US. Now we see a fairly strong relationship between cost of construction and growth rate (r2 of about 0.4)
A fairly basic model of city growth is that cities have increasing returns to scale: each additional person who moves to a city creates more benefits than the last (likely due to some sort of network effects - the nth person creates n - 1 potential connections/ beneficial relationships). These agglomeration effects are why cities exist at all.

(via worldbank)
However, cities also have diseconomies of scale - problems that get larger the bigger you get. As a city grows larger, transport becomes ever harder to manage, administrative overhead becomes more problematic, infrastructure becomes more costly to maintain and more expensive to replace, etc. A city's growth rate will thus be a function of the relative size of these two effects.
Increasing returns to scale implies that if something doesn’t stop them from growing, the largest cities should grow faster than smaller cities. In fact, this is what we see. If a large city isn’t growing, it then suggests that something is preventing it from doing so. The correlation between construction cost and growth rate suggests that expensive construction is something that slows down the growth of cities, and the ones that have managed to avoid it are the ones that are able to build more.
[1] - Partly this is a function of classification. DC, Maryland, and Delaware are considered part of the South, even though they’re obviously much closer to New York than they are to say, Houston.
[2] - Part of this is once again a function of where government boundaries occur - the NYC metro area is spread across 3 different states.
[3] - This map distorts the data slightly, as the 1-500 bubble is a bit too small by area. I opted for clarity over 100% accurate representation, as enlarging those bubbles masked other, more important trends.
[4] - Manufactured homes aren’t permitted, but the government tracks monthly shipments of them to maintain a picture of overall homebuilding.
[5] - One thing this doesn’t take into account is home size. Average square footage of homes has increased from 1600 in 1973 to 2400 today. Interestingly, this means we’re building almost the exact amount of square footage today that we did 50 years ago.
[6] - We’re pretty far from scientific best practices here, so take all the following conclusions with a substantial grain of salt.
[7] - We shouldn’t be surprised that there’s no correlation between home price and rate of growth. At the market clearing price, there will be equal numbers of buyers and sellers - equal number of people entering and leaving. Only a change in price can tell us something about demand changing
Feel free to contact me!
email: [email protected]