Getting multifamily development unstuck in 2024
Rising rates have made development increasingly challenging. What’s happening in the market now and what role can innovation play?
Today’s Thesis Driven is a guest letter by Jonathan Scherr, founder & CEO of Juno. A special thanks to Emily Mills Marineau and Natasha Sadikin, to Meg Spriggs at Lendlease, and to Dave Chattman at Related for their contributions.

2023 marked one of the most challenging environments for institutional real estate development. While big tech has kept the stock market surging, a slow-forming crisis has been looming over ground-up development. On the heels of one of the most aggressive interest rate increases in recent history, large-scale apartment development is down nearly 30% from this time last year and commercial property values have been softening meaningfully toward the end of the year. The real estate development industry spent much of the past year struggling to make any projects work, and few actually got there.
As we turn the page into a new year, we’ll break down some of the fundamentals of ground-up multifamily development and why 2023 was so challenging. In this letter, we will:
Describe some of the basic economic drivers of multifamily development;
Highlight the ripple effects of the broader macro environment and monetary policy on development; and
Describe some of the innovations that are currently aiming to improve the drivers of development to help the industry move forward as a new cycle hopefully emerges in 2024.
I will be simplifying a lot in this letter, so I’ll ask for forgiveness from real estate development professionals for any oversimplification.
The role of risk
It may sound obvious, but development (the act of creating a building from scratch) is riskier than buying a building that already exists, which means it needs to command a higher return for that risk. When investors buy a building, they literally have an asset that has some value. But developers merely start with a piece of raw land. That land must get permitted, a building needs to get designed on top of it, and a general contractor (and subcontractors) need to build the building on budget and on time.
Part I: The Economic Drivers of Multifamily Development
Developers and their investors consider many different metrics when they evaluate a development opportunity, but the primary metric that developers consider is Yield-on-Cost (YoC). Yield-on-Cost is the income a building will produce divided by the all-in development costs to achieve that income. It doesn’t consider how much of a mortgage the property has, but rather just looks at how well it will perform relative to the cost to get that performance.
In a simplified way, the YoC equation is as follows:

Let’s take an example of a 100-unit apartment development that a developer may consider building with the following assumptions:
Average monthly rent: $2,500
Average Vacancy: 5%
Average Operating Expenses as a % of Gross Rents: 35%
Potential Land Purchase Price: $1.85 million
Soft Costs = $2.0 million
Hard Costs = $25.5 million
Financing Costs = $3 million
Here the YoC on this hypothetical project would be 5.56%. I’ll layout how we got to that number from the assumptions highlighted above in the diagram below:

The target Yield-on-Cost of any development project must to be compared to the return an investor would expect if he or she bought a building that already existed and to the return of any alternative investment (including risk-free US Treasuries). Because development is riskier than just buying a building, the YoC has to be better (usually a full percentage point better) than the Capitalization Rate (Cap Rate) of existing buildings of a similar type in that market.
As an aside, a Cap Rate is a ratio between a property’s profit and the value of the property itself. It is used to understand the unlevered income of an existing property. The market and industry will dictate the cap rate for a property and are typically known in markets where there are a lot of active transactions. In Anytown USA, let’s just assume the prevailing cap rate for a nice apartment building (dubbed "Class A") is 4%. What that means is that the property is making 4% of its underlying value in operating profits in a given year. A previous Thesis Driven piece by Roman Pedan at Kasa covers the concept of cap rates fairly well.
Let’s just say that in this market in 2021, the cap rate for a relatively new 100 unit apartment building was 4.5%. In this case, the building that cost $32.35 million to build would be worth $40 million (Yield of $1.8M / Cap Rate of 4.5% = $40 million) once built. The risk of development leads to a profit of $7.65 million.
Part II: How we arrived at a perfect storm for development
The last few years have been anything but normal for development: while 2021 and the first part of 2022 were boom years, momentum slowed dramatically through the second half of 2022 and 2023.. I’ll try to bring the macroeconomics back to our example 100 unit project.
Inflation
We could spend multiple letters (a book even) on the fiscal policies that led to nearly 10% inflation in 2021 and 2022. But what’s important to know is that a key part of inflation was helping fuel development all while another was making it increasingly difficult. I’m specifically speaking about rent inflation and construction inflation.
Rent Inflation
Housing (dubbed shelter by the Fed) makes up about 40% of the Consumer Price Index (CPI). The chart below shows how significant shelter inflation has been, peaking to 8.2% on average. It’s worth noting that shelter is slower to show inflation compared to the rest of the CPI (a March 2023 peak vs. a June 2022 peak) because it captures both new and existing leases.

Rising rents have been fueled by two major factors: 1) the massive federal stimulus that put more money in peoples’ pockets to move into their own place or upsize; and 2) migration to new markets where there were acute housing shortages.
Going back to our 100 unit example, if we saw current rents 6% higher than last year, we’d start to underwrite more aggressive rent growth for our development project, which would push the YoC up to 5.9% from 5.65%

Construction Inflation:
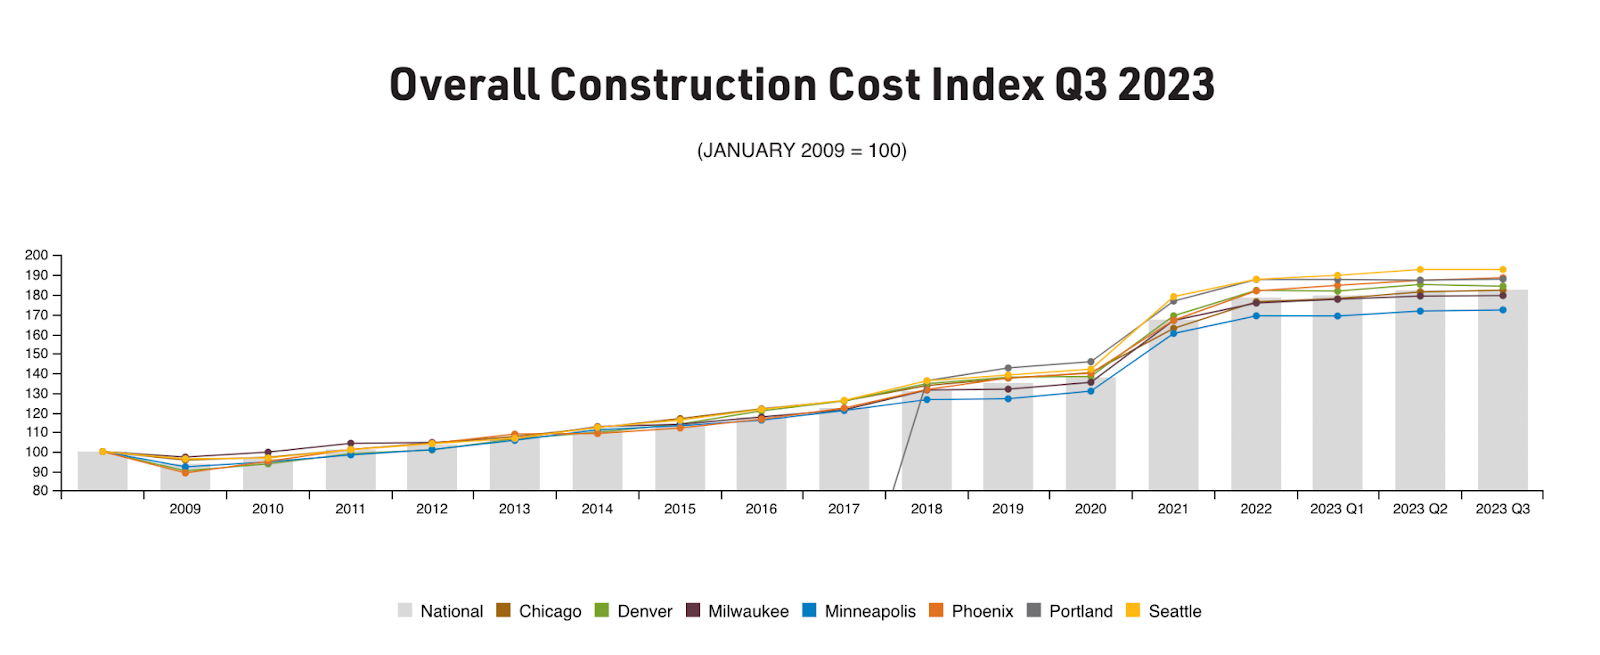
The increase in shelter CPI from 2021-2023 did indeed push many developers to justify continuing to push projects forward. The chart below shows this phenomenon in just one market, Denver CO.

In Denver, as with many other markets, the development gold rush allowed first movers to win big and–as of the end of 2022–Denver had some 24,000 units in development, a record number fueled by continued rent growth among other factors.
Such a large pipeline naturally increases the demand for the inputs to build: construction labor and materials. The Producer Price Index (PPI), which measures the change in pricing for US-produced outputs tells the story well.

The PPI increased 33% from January 2021 to November of 2023, the same amount it increased from January 2010 through December 2020. Put another way, construction pricing increased 5.4x faster than in the ten years prior.
Going back to our pro-forma, even if we assume a shock of 10% construction pricing inflation, we end up at $28.1 million in hard costs, which pushes YoC down below 5.5%

The Fed and Quantitative Tightening
As readers know, The Federal Reserve saw inflation spiraling out of control across the US economy and began a campaign of rate increases at an unprecedented rate since the end of WWII.
Below is the chart for the Standard Overnight Financing Rate (SOFR), the baseline borrowing rate for most real estate projects, from January 2021 through November 2023. Below you can see SOFR going as high as 5.25% toward the end of 2023.

The Fed’s moves have had a massive impact on multifamily development. For this discussion, I’m going to focus on two major ripple effects: cap rates and the availability of construction lending capital.
Cap Rates
When The Fed increased the federal funds rate as quickly as it did, it impacted the cost of capital (and implied return threshold) for every asset (starting with the yield on the 10-year treasury, which increased to 5% in Q4). If the return of lower risk assets increase, so must the required return for riskier assets like real estate. The result is a natural upward pressure on cap rates. Adding to this pressure is the federal reserve’s goal of curbing inflation, which increases the risk of a recession (and slower future rent growth).
So now if we return to our example where cap rates were 4.5% in 2021, it’s likely that cap rates have moved to 5.5% or higher–especially if risk-free investments can command a 5% return! With rising and volatile cap rates, developers must not only accommodate the rise in cap rates, but also add a buffer to accommodate the uncertainty of future cap rate expansion. This means means that a development has to achieve an even greater spread above an even higher theoretical cap rate. That 5.56% YoC now has to be 6.56%--or more.
To put this shock in perspective, a developer would now have to reduce hard costs by more than 20% (from $28.1 million to $22.5 million) to achieve that new target YoC, an unlikely scenario given the construction inflation issue mentioned above.
Construction Lending and Capital Availability
But increasing cap rates aren’t the only problem. Higher rates have also led to a deterioration in construction lending through 2023.
In most cases, developers take out loans to construct a building (dubbed a construction loan) and replace that loan with a mortgage (dubbed ‘permanent financing’) when the building is completed. In our 2021 example, we assume that a construction lender was lending at 6.5% for 65% of the ‘hard costs’ of the building ($16.6 million x 6.5%), or ~$1.08 million/year for 2.5 years ($2.7 million over that 2.5 years (add in $300,000 in fees to get to the $3 million financing cost number we assumed).
A construction loan only gets awarded if the lender thinks the value of the building will be high enough for another lender to give the building a mortgage and take them out for a similar dollar amount. To diligence this potential take-out, construction lenders divide the Yield (in our case $1.8 million) by the debt payments for the year (in a 2021 world, those payments were $1.08 million) to arrive at a Debt Service Coverage Ratio (DSCR)- in our case the $1.8 million / 1.08 million provides a DSCR of 1.7x, which is very healthy (typically lenders are looking for a DSCR above 1.25x).
However as rates increased in 2022 and 2023, lenders began to see two things impact DSCR. First, projected rent growth began to slow, which meant that the $1.9 million in Yield on our 100 unit project likely moved back to 1.8 or even down to $1.7 million.
Second, rising rates meant that a new lender may be lending at a 10% interest rate rather than 6.5%. The interest on a $16.6 million loan at 10% is no longer $1.08 million, it’s now $1.66 million. For a development in this market, 2.5 years of capital plus fees would equate to $4 million in financing costs.
If we keep the rental assumptions in our 100 unit building constant, but flex up our financing costs to $4 million, we now see the Project’s YoC down at 5.3%, a long way from the necessary 6.5% in a 5% cap rate environment.

However, because of construction inflation the amount needed to borrow increased and the rate has also gone up. Going back to DSCR, we can see that it’s fallen to 1.04x ($1.9 million / $1.86 million (10% x $18.625 million, where $18.625 million is 65% of $28.1 million). That ratio is below most lenders’ thresholds of 1.25x. Thus, a lender would not be comfortable with this opportunity, so obtaining a traditional construction loan would be extremely difficult if not impossible.
Other confounding factors
There are several factors exacerbating this problem, but I’ll focus on two. First, most lenders are not going to foreclose on their borrowers if they can avoid it. As such, construction lenders are extending their loans in the hope that rates will come back down and they can be ‘taken out’ on their existing loans. Until then, however, their capital is stuck in existing projects and not available for new ones (one reason why we see the volume of construction debt outstanding continuing to grow).
Second, when developers seek a loan to construct a building, they aren’t typically borrowing from JP Morgan Chase or Bank of America. According to Goldman Sachs, 80% of loans for commercial real estate (and arguably more for construction) have historically come from regional banks, banks like M&T Bank and PacWest, and Bank of the Ozarks ("Bank OZK"). Regional bank balance sheets were squeezed in 2023 as cap rates increased, office valuations plummeted, and depositor flight from the fallout of Silicon Valley Bank and First Republic Bank hit regional banks particularly hard.
When property values go down, the implied risk of a loan goes up (if a property has a $25 million loan taken out while the property is worth $40 million and the property is now worth $32 million, the loan has gone from being worth 63% to 78% of the property’s value). The higher the risk of a bank’s existing loans, the less they are able to lend for new loans. The impact of these factors has been significant: the first half of 2023 saw a 50.3% reduction in construction lending compared to the first half of 2022 ($209B vs. $421B).
Revisiting the Denver market, just two quarters later, new multifamily construction starts plummeted to their lowest point in more than 10 years.

With higher rates and decreased debt availability, developers have no choice but to raise costlier forms of capital. This means that either the yield portion of the equation must rise, the cost of construction must fall, or both. But in reality neither of those drivers are moving using conventional models. As a result, the market is stuck and has been for most of 2023.
But what about construction pricing?
One would naturally think that with a reduction in demand from developers, construction pricing would reset as well. But while high prices may be plateauing, they’re not declining. PPI tells this story in aggregate, but large General Contractors like Mortenson track their own indices that tell this story clearly.
Anecdotally, one factor driving this plateau is that contractors are still busy with 1) existing projects that need to be completed; and 2) the $369 billion in Federal Inflation Reduction Act (IRA) funding for clean energy projects. Ironically, the Inflation Reduction Act may actually make construction inflation worse, if not make it more persistent.
Part III: Getting unstuck: the role of innovation
Given all the current challenges, there has never been a better time for innovation in the commercial real estate industry. While there is no "magic wand" to fundamentally change the capital markets side of pro-formas, there are a host of innovators pushing new methods and technologies that can nudge each of the yield-on-cost levers in the right direction. Taken together, these nudges can help counteract the forces described above and prepare developers for greater resiliency in the next development cycle.
When we consider the "Yield" side of the equation (Gross rent - Vacancy - OpEx), there are a few interesting ways to help further improve the top-line of new projects, including:
Site optimization: Several new tools and technologies are being developed to help developers optimize for zoning and other attributes of a particular site to maximize its rental potential. Companies that fall into this category include testfit.io, cedar.build, among others.
Improved density: In development, density refers to the number of rent-paying individuals that can fit into a given square footage. There are a number of businesses that aim to increase total rent by reducing the average amount of space per user / tenant in a building. Co-living is an example of this solution, but more recently companies such as Ori Living have aimed to optimize space in more traditional apartments with mechanical furniture. Mass timber (discussed in greater detail below) and other creative design techniques can also improve density by adding additional stories at competitive cost for certain sites and building types.
Higher quality: Superior design and higher quality materials and finishes can attract higher rents, even in competitive markets. In our inaugural project in Austin, TX, our company Juno has been able to improve rents by more than 15% compared to more conventionally designed buildings by the use of more sustainable material, and a focus on design differentiation. However, innovators looking to improve rents by delivering a higher quality product must make sure the quality they are creating is something that translates to higher rents and/or lower vacancy all while not compromising the ongoing maintenance of a building.
Rental models: Other innovations can help both existing and new projects generate additional revenue per user, such as flex stay models being brought to market by companies like Kasa and Sentral.
When we look at the denominator of the YoC equation (hard costs, soft costs, acquisition and financing costs), there are some powerful ways to meaningfully improve the efficiency of commercial building design and delivery, including:
Design speed
The advent of generative and component-based design models–along with technologies that enable them–allow the fairly manual process of designing a fully detailed commercial building to be completed significantly faster. The ability to accelerate pre-development timelines means getting buildings permitted sooner, construction started earlier, and can reduce the soft costs (design costs in particular) of a building.
In single family development, Higharc is a prime example of how generative design can save design time and cut down timelines. In multifamily, our company Juno uses both generative design and rules-based design to reduce the effort of and/or automate significant portions of the design processes of a multifamily development.

Today, these models can cut soft costs of projects down by 5-15%, which helps improve YoC by 5-10 bps. While this number isn’t as substantial in isolation, design automation tools also help save developers ‘dead deal’ costs by helping them arrive at a ‘no’ much more cost-effectively. If developers measured their effectiveness using a CAC / LTV ratio, these tools would help increase returns even more.
The advent of AI will undoubtedly further accelerate these processes and make them even more valuable. AI will likely first impact the most ‘rules-based’ design activities–for example, structural engineering. However, most data remains highly unstructured and fragmented, something that will take a bit of time to resolve.
Construction speed
Saving time and money during construction is where the real value lies once a project is proceeding. In light of a construction labor shortage and high construction and financing costs, improving construction speed has a major impact on project returns. One, faster construction shortens the amount of time a loan is being paid for a project that isn’t generating income. Two, it cuts down the oversight costs that general contractors charge (called General Conditions and General Requirements). Finally, when speed involves prefabrication, new construction methodologies can create opportunities for labor cost arbitrage and cut down the direct costs of labor, which is highly market dependent.
Introducing technologies and operating models that speed up construction activities and introducing models that help coordinate and orchestrate site-built activities to ensure they are performed properly can both accelerate construction timelines. There are a few innovators pushing hard on construction speed in multifamily as well as many in single-family such as Mosaic and Homebound). Our company, Juno, uses a mass timber structural system we have developed along with some other prefabricated parts to reduce structural assembly times by 50%. There are a number of other impressive businesses like Assembly OSM, SLI, and VBC that are showing that speeding up construction timelines can translate to direct hard cost reductions.
The direct hard cost savings of going faster can be as much as 5% of a budget, which would translate to another 15-20bps improvement to YoC.
However, construction coordination is as important to improving construction speed as prefabrication. When something goes wrong on a construction site, it has a ripple effect that can crush timelines and balloon costs even further. As such, some companies like Planit are developing coordination services and technology, although scalability will likely be a challenge. Scaling and automating coordination is a massive opportunity for the future.
Financing costs
Innovations that change the risk or improve the carbon footprint of development have the potential to eventually reduce their financing costs–not to mention insurance. However, until models that drive efficiency in the design-build process have sufficient volume to demonstrate that lower risk with consistency, it’s unlikely that financing costs will come down significantly in the short-term.
2023 was a difficult year for developers, with projects needing to add another 100-150bps of yield to proceed. But between inflation slowing and the Fed signaling an end to rate hikes, we may be seeing a light at the end of the tunnel for institutional development. 2024 will be a year to reset, and the developers who embraced innovation and creative approaches will be the first to get unstuck.
—Jonathan Scherr
Thank you for reading Thesis Driven. Enjoyed this letter? Please share it!

Recommend Thesis Driven to the readers of Devon's wanderings
A deep dive into emerging real estate themes and the innovators capitalizing on them
 | A guest post by
|

 | Incredible insight. This letter is so well thought-through, informative, and well articulated. Thank you! |
| Wow. What an amazing article. I’m really looking forward to more actionable analysis!!! For those not familiar with Reno -- the Tesla Gigafactory is located at our Tahoe Reno Industrial Center (TRI Center, or TRIC) -- a privately owned 107,000-acre (167 square mile; 430 square kilometer) industrial park. TRIC is the largest industrial park in the United States. In addition to Tesla, our top employers include Amazon, PetSmart, Home Depot, Urban Outfitters, Microsoft, Google, Apple, Patagonia, Walmart, Intuit, and many more now and on the way!!! As, you can see below, our multifamily market has ramped up since Tesla went into full production in early 2017. However, total housing supply within our 5-county CSA has failed to meet demand. https://rebusinessonline.com/reno-multifamily-market-soars-to-new-heights-in-past-decade/ MY REQUEST TO READERS: At my company, Regenesis Reno, we're speaking with our top employers about scenarios for lowering the YoC for new development, providing master leases guaranteeing 0% vacancy for a specific term for new or existing multifamily projects, and providing private sector housing vouchers modeled on Section 8 vouchers. Can any readers provide links to best practices or even employers and/or metros that use these approaches? Background on my company is here: www.RegenesisReno.com/aboutus Since 2014, Tesla has invested $6.2 billion in Nevada and built a 5.4 million square foot Gigafactory. At the end of 2023, Tesla had more than 7,000 team members. Tesla plans to invest over $3.6 billion more to continue growing Gigafactory Nevada, adding 3,000 new team members and an electric semi-truck and battery manufacturing facility: a 100 GWh 4680 cell factory (with capacity to produce enough batteries for 1.5 million light duty vehicles annually), as well as the first high-volume Tesla Semi factory. More info here: https://goed.nv.gov/wp-content/uploads/2023/02/3-A.-Tesla-Inc.-Board-Packet-PG-1-19.pdf Elon is intensely pressuring local managers to solve Reno’s housing crisis. Help!!! We need more workforce housing!!! |


 Start Writing